The SPDR S&P 500 ETF (NYSEArca: SPY) is testing the 2000/2007 highs — levels only reached at the peak of two previous bubbles.
This report looks at the last two bull/bear markets in the S&P 500 via SPY to see if there is anything to learn from the past to help predict the future as the bulls and the bears are setting to square off.
Prelude to a Bear Market: 2000-2002 vs. 2007-2009
Let us begin by dissecting some of the similarities between the prior two bear markets that culminated from the tech/telecom bubble and the housing bubble/financial/credit crises, et al.
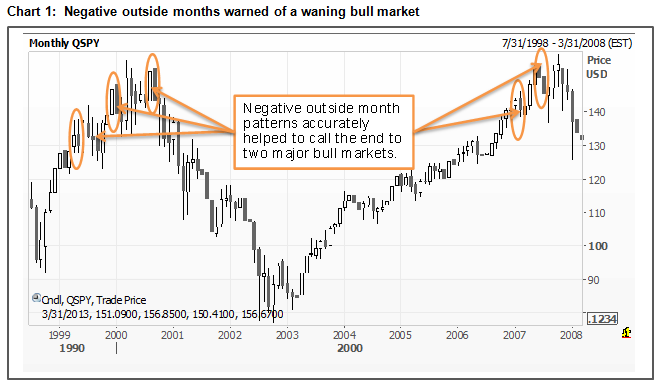
A “negative outside month” is a technical pattern which forms when the high of one period is above the high of the prior one, the low is lower than the prior period’s low, and the closing price is below its former close. Granted there are some variations to this pattern, but the takeaway is that it is a sign of distribution. Also, the fact that it is a monthly pattern and not daily or even weekly is significant as it takes a concerted effort of investors form.
Note that in 2000 there were negative outside month patterns in January/July/September 2000 and then again in February/July 2007 forewarning the end of a bull market.
A “death cross” is a technical indicator devised using two moving averages, in which a shorter-term moving average crosses below a longer-term moving average. This is often used as a signal that the bears have taken the upper hand over the bulls. In order to avoid being whipsawed it is generally advisable to await confirmation when both of the moving averages begin to trend down. The opposite would hold true for a “golden cross” signal. Theoretically, any two time periods can be used, but when monthly (10/30) moving averages converge it is generally a sign that a major battle is going on under the surface between the bulls and the bears. In the chart below, note the death cross signals in May 2001 and July 2007. Soon after, both of the moving averages rolled over (trended down), thus confirming the subsequent bear markets.

All told, both bear markets were vicious. Back in 2002, the tech/telecom bubble was in full bloom and the Technology Select SPDR Fund (XLK) dropped 82%. By no means did this leave the broader equity markets unscathed. In fact, it took some 31 months and a 50.52% decline in SPY for the 2000-2002 bear market to run its course. Similarly, during the 2007-2009 bear market the Financial Select SPDR Fund (XLF) lost 85% of its value and SPY declined 57.40%. However, it took only 17 months. In either case, each bear market came to an end and the market began the process of healing the technical damage.

A Bull Market is Born
As all bear markets come to an end, so did these. It is typical that after powerful sell-offs, a bottoming process, rather than a single event, needs to occur before the emergence of a bull market is revealed. This is the market’s way of exhausting the sellers and in some cases can take many months.
After the tech/telecom bubble, SPY reached a price bottom in October 2002 (77.07), but it would take a higher low in March 2003 and the subsequent breakout in June 2003 to confirm that a major bottom has been put in place. A similar situation occurred when SPY reached a low of 67.10 in March 2009 as it took several months and a positive outside month pattern in July 2009 to confirm an end to this bear market. Also interesting was that as the monthly death crosses previously passed the torch to the bears, the golden cross signals in January 2003 and July 2010 passed it back to the bulls.
