With the Dow recently closing at a record high and exchange traded products (ETPs) kicking off 2013 with their strongest January-February inflows on record, there has been a lot of buzz about new cash coming into the market. If investors are finally deploying some of that cash that had been sitting on the sidelines, it raises an interesting question: What is the “right” amount of cash to hold in a portfolio? And is this a good time to take cash holdings and put them back into the market?
To answer these questions, I took a look at investor behavior around cash holdings during the last few economic cycles. In particular, I have taken data on individual investor cash holdings from the survey that the American Association of Individual Investors has been conducting since November 1987 (right after the stock market crash of 1987). Individual investors are asked to report on their allocation to equities, fixed income and cash during the month the survey is conducted. I’ve plotted that data on the chart below.
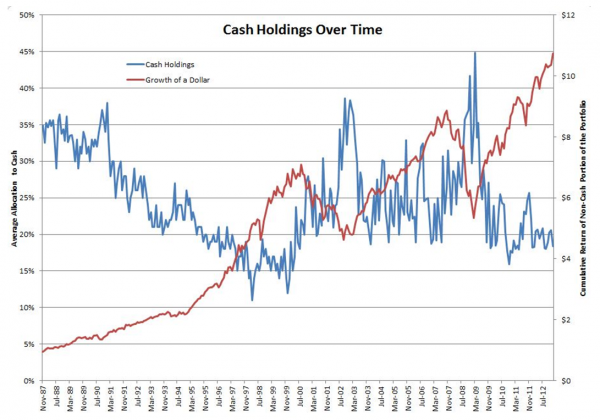
On the left axis, you’ll see respondents’ average allocation to cash as percent of the total individual investor portfolio. On the right axis is the cumulative return of the non-cash portion of the portfolio (shown as the value of a dollar invested at the beginning of the period)[1].
It is interesting to see how the peak levels of cash holdings seem to correspond to the bottoms of market cycles, and the lowest levels of cash holdings seem to correspond with the top of market cycles. In other words, when stock prices were low, investors were holding on to a lot of cash. As stock prices rose, investors were putting their money back into the market. Indeed, cash holdings were high right after the 1987 crash and steadily declined as the market rallied in the 1990s. They bottomed out almost exactly when the tech bubble burst in early 2000.
We then saw investors pull back their investments and go back into cash as the market declined. This means investors ended up with peak cash holdings when the rally of the mid-2000s started around the middle of 2003. The cycle repeated itself into the peak of the market before the last crisis, with investors showing the highest level of cash holdings as the market bottomed in the middle of 2009.
This appears to be one more manifestation of trend-chasing often exhibited by investors. Indeed, the chart below shows that on months when the survey reports a reduction in cash holdings, the non-cash portion of the portfolio had, on average, much higher returns in the preceding period than in months when the survey reports increases in cash holdings1. In other words, when returns have been good investors reduce their cash holdings and invest more in risky assets, and vice-versa when returns have been poor.
How effective is this cash-timing behavior that investors seem to follow? Unfortunately, it has not shown to be very effective. The chart below shows that returns, on average, are about the same in the month after cash holdings are reduced compared with months when cash holdings are increased. Even more discouraging, average returns in the year after cash holdings are decreased are actually smaller than when cash holdings are increased.
