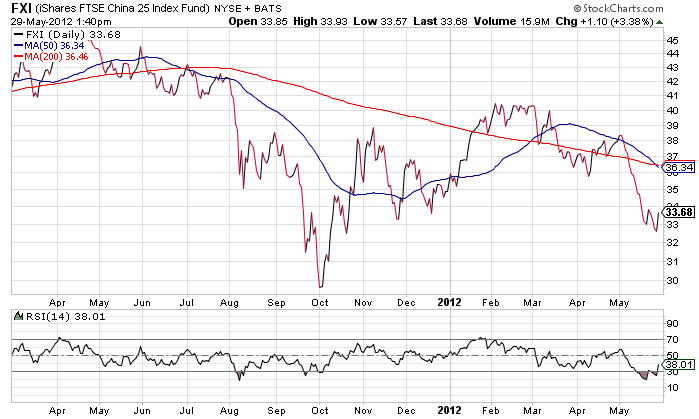
For FXI, the level just above $33 a share “is very important support that held back in the fourth quarter of last year,” says J.C. Parets at All Star Charts.
“This new found support created the higher low that helped take FXI to six-month highs earlier this year. More importantly this price also represents the 61.8% Fibonacci retracement from those key October lows that we always talk about in most of the major averages,” he wrote.
Meanwhile, the FXI price chart and momentum indicators are showing a bullish divergence.
“If this was indeed a false breakdown, I would expect a fast and powerful move higher in FXI,” Parets said. “This would certainly be a positive for U.S. equities and other risk assets.”
iShares FTSE China 25
