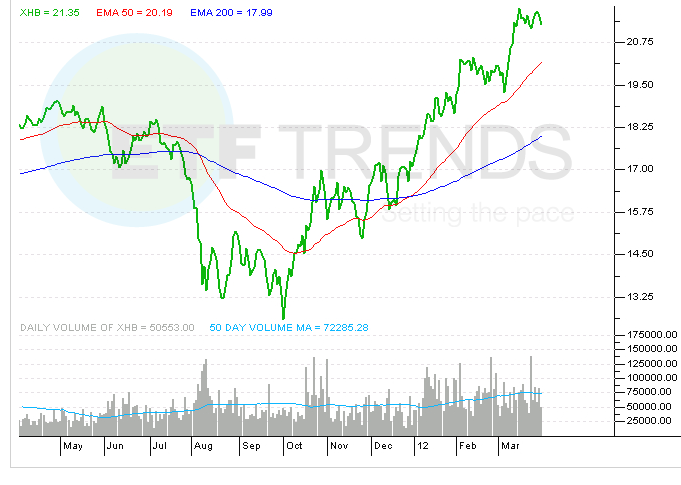
XHB for instance is up 5.86% in the trailing one month period versus the S&P 500 up 2.81%, and year to date has rallied 24.73% versus the S&P 500 up 12.13%. XHB closed Friday at $21.35 and is within a stone’s throw of a multi-year high of $21.99 that was touched early last week.
Even though the presence of put buyers has been limited to one trading session and is far from an observable trend at this point, we will be watching the sector with vigilance in the near term for further indicators that it will continue to challenge new highs or perhaps give back recent gains.
SPDR S&P Homebuilders
For more information on Street One ETF research and ETF trade execution/liquidity services, contact [email protected]
