If you’re going to use a trend following discipline with exchange traded funds (ETFs), you may find it beneficial to understand moving averages, what they mean and key differences between the two most popular types.
There are two common types: simple moving averages (SMA) and exponential moving averages (EMA).
The SMA is calculated by tracking the price of a security over a specified time period. Over time, the averages are assembled into a smooth line giving an investor a clear picture of a trend. For a five-day moving average, one would take the closing prices for the last five days, then divide by five. As time marches on, the old data is dropped and new data is factored in. [Why Buy-and-Hold Is Dead.]
The EMA comes by way of a tricky formula that resembles something Matt Damon drafted out on a chalkboard in Good Will Hunting. The EMA really differs from the SMA in that it gives the most weight to more recent data. Therefore, the EMA is consistently closer to the actual price and it’s also quicker to pick up on trends because of the greater weight on more recent data.
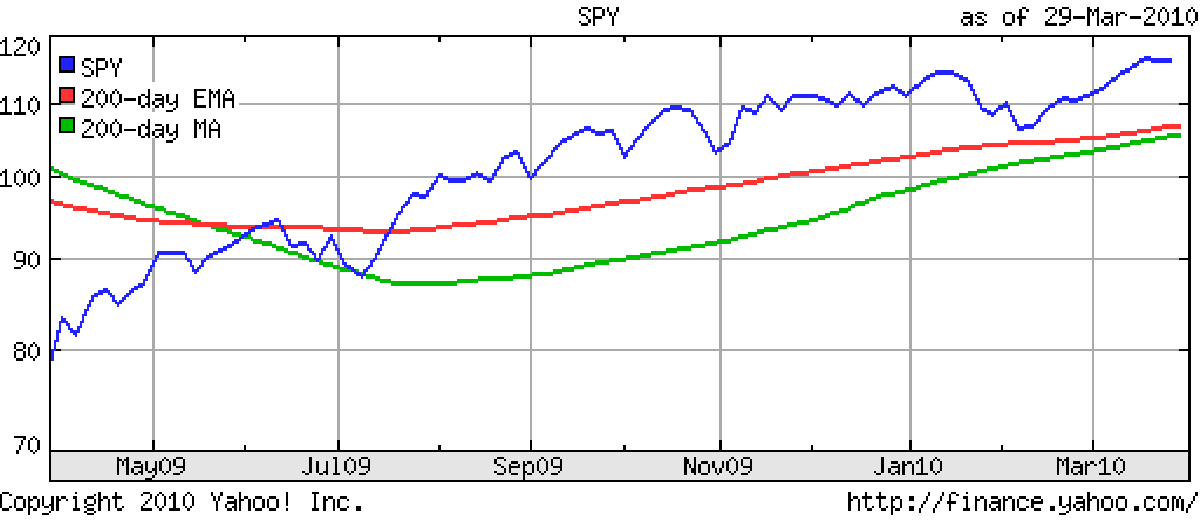
You can see the impact the two different formulas have in this chart:
Which moving average you use depends on your personal preference as well as your investing style.
