It’s no secret that commodities and their exchange traded funds (ETFs) have been on a wild ride for the last year or so. But just how much are speculators to blame?
A Giant See-Saw. Oil has been especially volatile. Last July, it peaked at $147.27 a barrel before plummeting to multi-year lows. Then it touched $50 a barrel last week, and now it’s back down below $40, says Aaron Task for the Tech Ticker. The source of this volatility has been a topic of much discussion.
But how much can we blame speculators? Task seems to feel the answer is “not much,” because we can’t blame Wall Street for everything that’s wrong in the world right now. It’s not without flaws, but there’s so much more at play, according to Barry Ritholtz at the Big Picture.
- The hot markets attract the hot money.
- Oil is priced in U.S. dollars. A weak dollar made oil especially attractive.
- Oil prices were rising in the middle of a global expansion.
- China, in particular, had a spectacular boom and was filling its Strategic Petroleum Reserves.
- SUVs and trucks were rapidly replacing cars and trucks on the streets.
- Terrorist groups have attacked supplies, while hostile actions toward the United States have disrupted prices, as well.
More Grim News. Other news about commodity sectors should be emerging soon, as well. The S&P 500’s basic materials sector is expected to show its weakest fourth-quarter earnings of all, down 69%, because of the commodity bubble burst, report Peter A. McKay Geoffrey Rogow and Rob Curran for The New York Times.
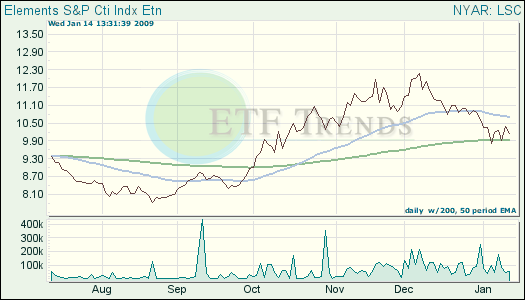
Most commodity funds have gone along for the rocky ride, but there’s an exchange traded note (ETN) many may not be aware of that is both long and short on commodities, depending on the trend. The ELEMENTS S&P CTI ETN (LSC) allows commodities to be either long or short (except the energy sector which is long or flat but never short). Rather than going down with a sinking ship, the indicator can adjust its positions on a monthly basis, depending on how the individual commodities are trending at month’s end.
The fund is above its 50-day moving average, and is up 5.3% for the last three months.
The opinions and forecasts expressed herein are solely those of Tom Lydon, and may not actually come to pass. Information on this site should not be used or construed as an offer to sell, a solicitation of an offer to buy, or a recommendation for any product.
