Wealth management practitioners have long sought to match client financial needs with an appropriate mix of available products and services. As a cornerstone to their service theme, financial advisors aim to solve complex client problems by offering unique solutions to differentiate themselves in the marketplace.
Key factors such as a client’s risk/return profile, investment time horizon and experience help advisors gauge appropriate solutions. Due to technology and the evolution of investment products and services, solutions have become more specialized. Innovation in both product and access points have forced the practitioners ’value proposition to become more competitive.
This has resulted in a focus on portfolio asset class compositions, performance against goals and benchmarks and costs relative to a wider spectrum of available solutions. Utilizing exchange traded funds (ETFs) provides specialized access to target exposures such as core asset classes, including cyclical sectors and desired valuation styles via index tracking products. Strategic asset allocation access to passively tracking pure single-theme indexes allows for a multi-step client assessment and then implementation. The next chapter of this thematic evolution for a portfolio solution is the way of goal-oriented all-in-one products such as multi-asset yield intelligent products.
A number of factors help interpret the demographics of the U.S. investor. A macro trend is baby boomers looking for portfolio income in light of all-time low interest rates. These rates are due to the quantitative easing programs sponsored by the Federal Reserve to help encourage an economic rebound from a number of significant market events stemming from the financial crisis of 2008, and the ensuing recessionary, low-employment periods.
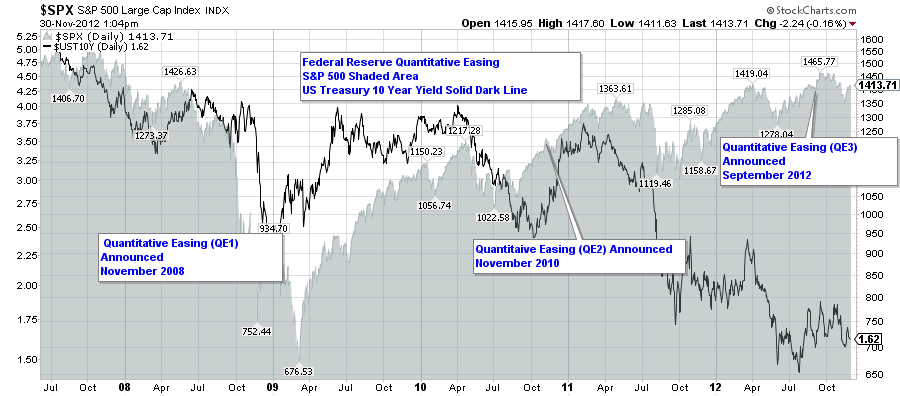
Figure 1 illustrates the major market phases and the quantitative easing phases along with the index level of the S&P 500 and the U.S. 10-year note from July 2008 to November 2012. We can see that the prevailing yield on the 10-year note was driven down over time to 1.62%.
Figure 1: Quantitative Easing Phases, S&P 500 and U.S. 10-Year Note
The crisis, coupled with flat returns of the overall market, known as the “lost decade,” have led to advisors’ innovation as part of the value-add, with the gains benefiting their contingency, as shown in Figure 1. Furthermore, the declining yield of the average retail portfolio which is compromised of the two core asset types, equity and fixed income, in Figure 2, exhibits the new market yield expectation.
Figure 2: Lost Decade for the S&P 500

Along the same theme, traditional sources of portfolio yield and the cornerstone to strategic asset allocation is a combination of uncorrelated asset classes. As a premise, the combination, which is comprised of a 60% allocation to core equities and 40% to core fixed income, is heavily reliant on the non-correlation of these two asset classes. Figure 3, core allocations to the S&P 500 and Barclays Aggregate Bond (AGG – iShares Aggregate Bond ETF), illustrates the portfolio effect on equities when there is a change in correlations in the asset classes. Figure 4 illustrates the downward movement of the yield of the 60/40 over a longer period.
Figure 3: Historical Yield of the Traditional 60/40 Portfolio

Figure 4: Yield of the 60/40 Portfolio

The illustration shows the annualized yield for a hypothetical blended portfolio of 60% S&P 500 Index and 40% Barclays Aggregate Bond Index, using monthly data points from 6/30/1982 to 6/30/2012. Index returns assume reinvestment of dividends, but do not reflect any management fees, transaction costs or expenses. Indexes are generally unmanaged and are not available for direct investment. Sources: Standard & Poor’s/Barclays; calculated using FactSet.
Secular Themes, Secular Yield
Overarching patterns have helped financial professionals to identify and statistically group market behavior into cycles. In Figure 5, secular trends are identified with fundamental and technical explanations to provide context to historical performance of the market in these cycles. These dynamics put in context grander macro trends of investor behavior, and help explain shorter-term volatility.
Figure 5: Market Cycles – Secular Bull and Bear

Dynamics of Sourcing Yield
Strategically sourcing yield begins with traditional 60/40 exposure and the narration of the yields from U.S. Treasuries and notes. These assets have historically been the most non-correlated asset classes, but because of systematic reasons, they do not offer competitive yields, as seen on Figure 3. Traditionally non-correlated asset classes naturally offset rising prices, and should be taken further into yield-producing asset classes as an expansion of sourcing portfolio income.
Gaining exposure to a mix of global asset classes and then equally weighting asset types such as energy income, real estate income producers, proven equity income (distinction with only equity) as well as fixed income corporate debt and sovereign debt bonds creates a stream of diversified income with exposure to returns of the smaller constituents. Equal weighting these asset classes also helps mitigate relative price underperformance of individual securities and diversify inflation risk by capturing distributions for investors.
Asset classes tend to participate in upward price movements due to their quality inclusion. Next to commodities, asset classes with an ability to make distributions have market liquidity and are a good hedge in inflationary times due to their upward capture in price increases.
