Vanguard firmly believes that Treasury Inflation-Protected Securities (TIPS) can play a valuable role as part of a broadly diversified portfolio. However, it’s important to understand that the broad TIPS benchmark—the Barclays U.S. Treasury Inflation Protected Securities Index—possesses high interest rate risk (i.e., high portfolio duration).
Given today’s low or even negative real yields and relatively high interest rate sensitivity, TIPS investors face risks that should be carefully evaluated.
TIPS were first issued in January 1997 by the U.S. Treasury. They have become increasingly popular as a guard against the prospect of rising inflation.
In the three years ended June 30, 2012, TIPS mutual funds garnered about $42 billion in net cash flow—$11 billion in the final 12 months alone. (As of June 30, 2012, they had an approximate market value of about $796 billion, which equates to approximately 12% of the Treasury market. Of this amount, a bit more than $138 billion was invested across various mutual funds.) The three-year cash flow represented just under 50% of the net cash flow received by TIPS funds in the ten years through June 2012. (Sources: Barclays and Morningstar, Inc.)
Over this same period, real (inflation-adjusted) yields declined to the point that a recent auction of a 5-year TIPS bond offered a real yield of –1.08%. The fall in real yields has led to high returns for TIPS—10% per year for the three years through June 2012 and 12% in just the last year of that period (which seems to have further fueled investor interest in TIPS. (Source: Barclays U.S. TIPS Index as of June 30, 2012.)
For long-term investors, TIPS can play a valuable role in a portfolio, given TIPS’ embedded relationship to inflation. The U.S. Treasury adjusts TIPS’ principal periodically to reflect reported changes in the Consumer Price Index for Urban Consumers (CPI-U).* For investors concerned about inflation, TIPS’ returns have historically demonstrated a positive correlation to inflationary surprises, or “unexpected inflation.”
However, despite oft-discussed inflation fears due to the actions of the U.S. Federal Reserve following the global financial crisis, realized inflation has remained tame. Forward-looking metrics represented by the 5- and 10-year break-even rates of inflation (BEI)** have also stayed within a range of about 1%–2.5%. This is critical for investors to understand, because the BEI reflects all investors’ collective expectations about future expected inflation.
Investors who are increasing their allocation to TIPS today are therefore accepting minimal compensation, and are forgoing the inflation risk premium associated with nominal Treasury bonds for the expectation of positive real returns.
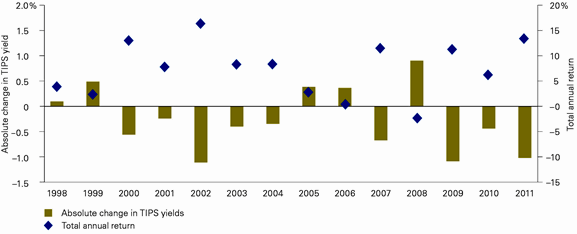
Although TIPS adjust principal for changes in CPI-U, such protection comes with exposure to interest rate risk (as with any bond investment). Because many TIPS in the current market are debt securities of longer maturity, they are subject to price volatility and loss (sometimes significant) resulting from unexpected changes in investor concerns about inflation, changes in real interest rates, or other factors in the market or economy. For instance, as highlighted in Figure 1, as real yields increase (or decrease), the total return of TIPS would be expected to decrease (or increase).
Figure 1: Changes in real yields and TIPS’ total returns: 1998–2011
Note: Annual changes in real yields and total returns represented by Barclays U.S. TIPS Index.
Sources: Vanguard and Barclays.
As Figure 1 shows, for the period 1998–2011, as real yields fell, total returns were positive. In the few instances since the introduction of TIPS in which real yields rose (for instance, 2008), TIPS’ total returns were lower or even negative. Figure 2 expands on Figure 1’s data by showing the best and worst monthly, rolling one-year, and rolling three-year annualized returns for TIPS.
Figure 2: TIPS’ risk of loss: March 1997–June 2012 (monthly data)

Note: TIPS’ benchmark returns in the United States began in March 1997.
Sources: Vanguard and Barclays.
Even though, historically, over a longer period such as three years, real returns were slightly negative in a worst-case scenario, the downside was much less than over shorter periods. As the time period lengthens, the inflation adjustments contribute more to the average total return, helping to offset short-term movements and reducing the likelihood that an investor will receive a negative real return. For instance, since March 1997, only 3% of the monthly rolling three-year real returns were negative, compared with 16% of the monthly rolling one-year returns.