

By Gary Stringer, Kim Escue and Chad Keller, Stringer Asset Management
Market volatility tends to be persistent and can continue for a while. The current environment has been devoid of volatility for so long that we are certainly overdue. On average, the U.S. stock market has a sizeable correction roughly every 18 months, and until recently we had not had a corrective move in almost exactly two years. Importantly, volatility also does not end because a new calendar month begins. It can take weeks for the market to work out shifting volatility regimes based on new economic and market information.
As volatility and markets normalize, we will again see their movement reflect the prevailing economic fundamentals. Overall, the indicators that we track suggest optimism for the global economy and risk assets, such as equities and commodities, so we think investors should maintain these exposures consistent with their overall plan. If our signals were to shift, our strategies would follow suit.
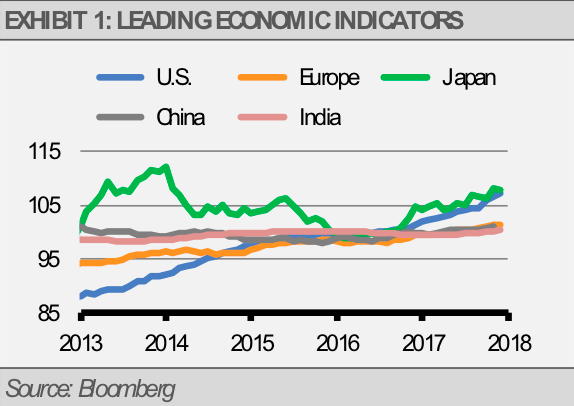
The global economy is firing on all cylinders as seen in the following chart of the Leading Economic Indicators (LEIs). We are witnessing “global economic synchronization,” which refers to all major global economies advancing at the same time. This is a rare occurrence and one that should be appreciated. That said, we expect the pace of growth to reduce as some indicators of business confidence and investment are at unsustainable levels. We expect the economy to continue to grow, but some of the recent positive economic reports are likely to come back down to normal levels. While this softening may result in equity and commodity market volatility, fundamentals remain strong, so we remain invested in the business cycle at this time.
![]()
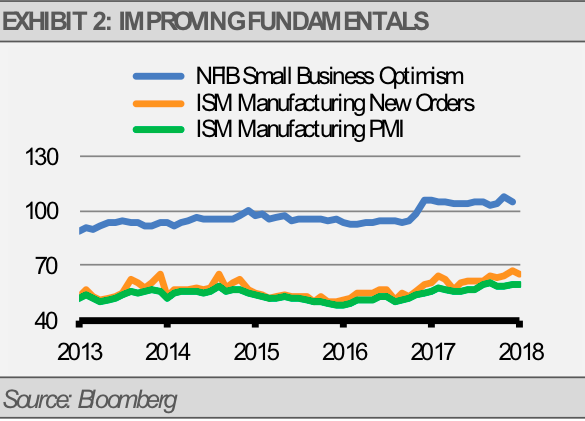
For example, the latest ISM Manufacturing Index reading of 59.1 suggests real U.S. GDP growth of approximately 4.0%. This growth rate is roughly double the sustainable rate estimated by the U.S. Federal Reserve. Furthermore, both the ISM New Orders Index, which tends to lead business investment, and the NFIB Small Business Optimism Index are nearing all-time highs (exhibit 2). Based on history, both of those indicators are likely to fall back after crossing new highs rather than remain at lofty levels for long periods of time.
We are seeing economic strength around the world with euro zone economic growth in 2017 at its fastest pace since the global financial crisis. While the euro zone’s growth last year was competitive with the U.S., we think that pace is unsustainable given Europe’s structural headwinds. Also reflective of global economic strength, Japan’s export business has been booming as global demand remains strong. However, their exports should slacken if for no other reason than year-over-year comparisons get more difficult at these high levels.
Major equity market risks tend to come with economic recessions. We see little chance of a recession in the near-term. Global central banks remain supportive of economic growth, monetary conditions continue to look healthy, and though we expect many of our fundamental leading economic indicators to soften in the weeks ahead, these indicators should stabilize at levels supportive of further economic growth. We think investors should be prepared for volatility and either look past it or take advantage of it.
Our strategies are generally overweight the sectors that we think offer attractive valuations compared to the broader market. For example, since the beginning of the year, analysts have increased their forward 12-month earnings expectations for S&P 500 Index companies by nearly 16%, yet earnings expectations for value (the S&P 500 Value Index) and midcap companies (the S&P Midcap 400 Index), two of our favored areas of the U.S. equity market, have increased more than 18%. Additionally, considering the recent equity market declines, the forward price-to-earnings (PE) ratio of the S&P 500 Index has decreased more than 17% since the beginning of the year, while the forward PE ratio for value is down more than 19% and the ratio for midcap stocks has fallen more than 22% based on stronger earnings expectations and lower prices.
THE CASH INDICATOR
The recent rise in the Cash Indicator (CI) level is similar to the volatile market declines of 2011 and 2016. While the CI has experienced a large upward move, especially considering the long period of low volatility we have experienced recently, it is not to a level where we would raise significant amounts of cash.