

Increased number of insured has translated into higher premiums and greater insurer exits
By Richard Fredericks, Main Management
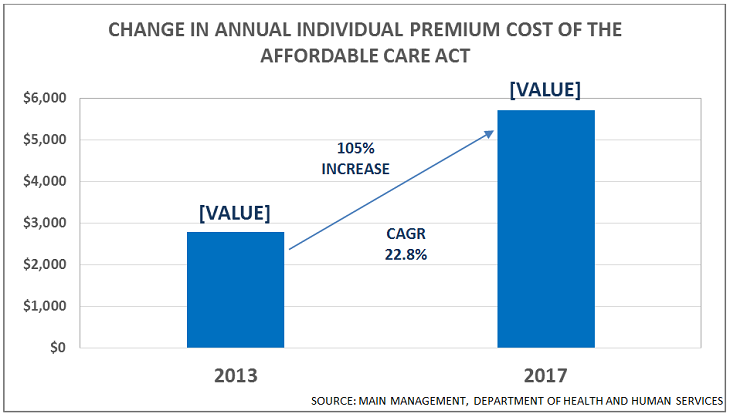
The Department of Health and Human Services (HHS) released a report in May that showed that the average premiums have DOUBLED for individual plans since 2013 which is the year before many of the Affordable Care Act (ACA), also known as Obamacare, regulations and mandates took place. HHS Spokesperson Alleigh Marre noted that “With data that shows average premiums doubling nationwide and Americans paying nearly $3,000 more for health insurance per year, this report is a sobering reminder of why reforming our healthcare system remains a top priority of the Trump Administration. The status quo is unsustainable.”
The HHS report included the following observations:
- Average individual market premiums more than doubled from $2,784 per year in 2013 to $5,712 in 2017 according to Healthcare.gov, an increase of 105%.
- All 39 states using Healthcare.gov experienced an increase in individual market premiums from 2013 to 2017.
- 62% of the states using Healthcare.gov had 2007 premiums that were double the level that prevailed in 2013.
- Three states experienced prices that tripled since 2013.
Some of Main Management’s observations follow:
- The simple “average” increase of the states is 13%. The figures translate into about $3,000 more for the average family.
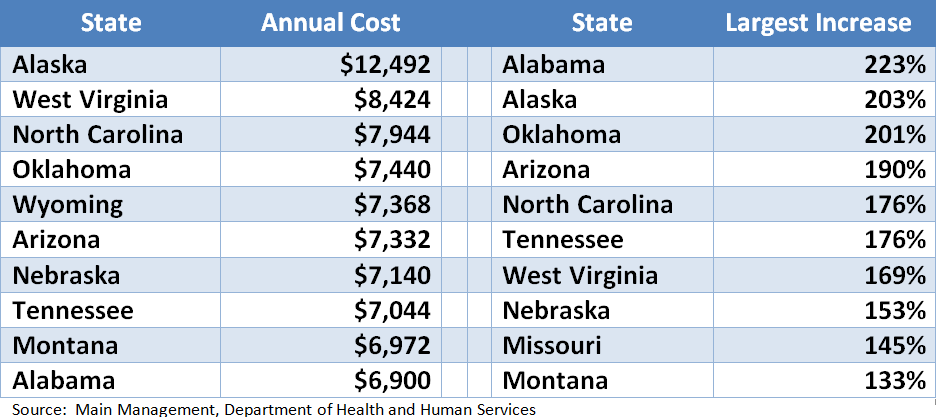
- The 10 states with the highest current premium costs and the highest increase in the premium costs since 2013 are shown below:
- Numbers on deductibles are harder to come by, but “eHealth” posted their view of historic deductibles this past January and indicated that deductibles for individuals have gone up 30% since 2013 (from $3,319 to $4,328 currently) and 107% since 2008. Family Plan deductibles have increased even more rapidly at 97% and 202% respectively, over those same time frames and the typical deductible is now $8,352.
- Out of the 23 original ACA Co-Ops, 17, or 74%, have been closed. Bloomberg News noted that “Most of the original 23 co-ops have failed, dumping more than 800,000 members back onto the ACA markets over the last two years … with more of the nonprofits on the brink of folding, the situation for the remaining providers looks dire.”
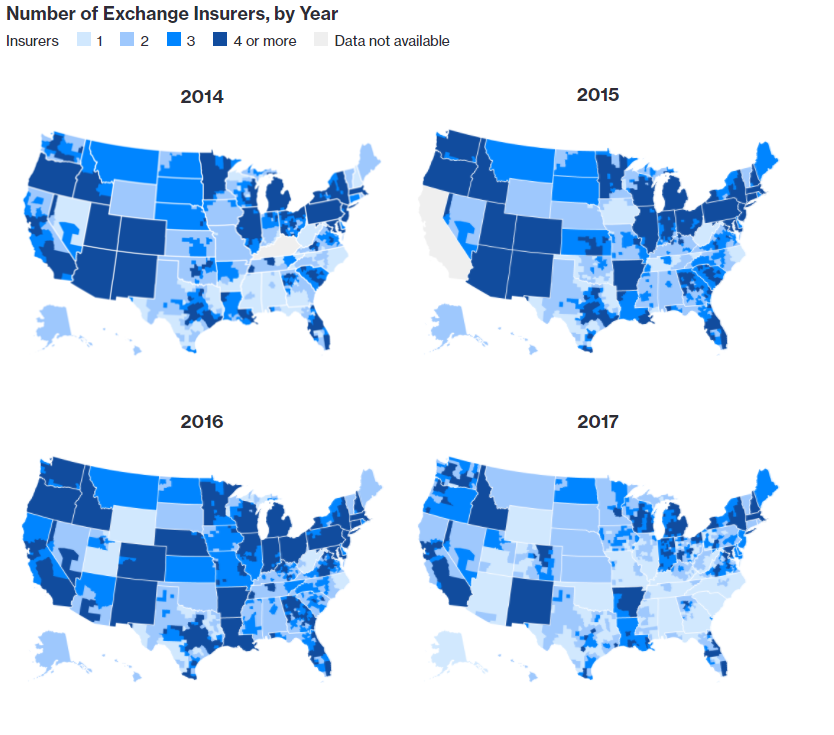
The visual below shows pictorially how insurance coverage has been fading across the United States under the ACA over time. According to the McKinsey Center for U.S. Health System Reform, there are now 5 states – Alabama, Alaska, Oklahoma, South Carolina, and Wyoming with only one exchange insurer. Another 12 states have only 2 options. From a county standpoint, 70% of America has only one or two choices.
The number of counties where there is only a monopoly insurer choice has risen from 7% of all US counties in 2016 to 1,030 counties, or 33% this year. There are another 1,164 counties (37.0% of all US counties) where there are only two choices; 599 counties (19.1% of all US counties) with three choices; 196 counties that have four providers (6.2%% of all US counties); and 153 counties with five of more options (4.9% of all US counties).
While it is true that around 20 million Americans are now insured that weren’t before, the majority of those who did receive coverage qualified for Medicaid. The ACA made the guidelines for Medicaid eligibility easier in 2009, so 31 states plus the District of Columbia took advantage of the new criteria and expanded the Medicaid program. In 2014, there were 9.25 million people enrolled in the ACA exchanges. Of that total, 8.99 million (97%) were enrolled in Medicare.