

By Joe Smith, CFA, CLS Investments
Investors continue to focus on factor investing as more ETF issuers launch single and multi-factor ETFs that target risk premiums through rules-based indexing. Multi-factor ETFs are particularly popular as advisors evaluate the merits of using them in place of traditional active management.
Despite the promise of combining multiple factors into a single portfolio exposure, many of these indices (and their ETF counterparts) are constructed differently and deliver their promises in varied ways. This can lead to questions during the due diligence process, including:
• How much exposure results from each factor being targeted in the portfolio?
• How consistent is the construction of these portfolios with the typical behavior of an active manager?
To answer these questions, we’ll review the current index construction methods for multi-factor ETFs to identify similarities and differences. We will also derive an alternative construction approach based on Bayesian statistics to capture how active managers incorporate factors into their decision-making. Finally, we will compare hypothetical portfolios based on each construction method to compare and contrast their risk and return properties.
What Multi-Factor Indices Have in Common Today
The impetus behind combining factors into a single portfolio is an easy case to make for investors. Over long periods of time, combined factors can provide opportunities to beat the market with odds that offer a statistical edge in both up and down markets.
Most multi-factor indices or ETFs tend to follow two primary methodologies: factor-mixing or factor-tilting. Let’s review a simple example: how do three stocks (JPMorgan, Apple, and Best Buy) show up in each type of multi-factor index based on their factor characteristics measured on December 31, 2016?
We generally use three measures for value: price-to-earnings, price-to-sales, and price-to-book; 12 minus one month price return for momentum; one-year volatility for minimum volatility; and two measures for quality: return on assets and long-term debt to capital. In addition, we measure the inverse of the log- market capitalization to assess the size as a factor characteristic. Each factor characteristic has been normalized into a Z-score relative to the entire universe of stocks in the MSCI USA Index. We use a cumulative distribution function of a standard normal to then generate single-factor scores for each stock in the index. These factor scores can be thought of as the probability of a given stock exhibiting the factor in question.
Factor-mixing involves taking a number of single-factor indices and weighting them (and their underlying holdings) to determine the final list of securities and their allocations represented in the portfolio. In most cases, this will result in owning a considerable representation of the underlying benchmark due to allocating to multiple factors that tend to be diversifying or negatively correlated with each other (value and momentum, for example). As illustrated below, each stock’s representation of each factor index varies both by how strongly it scores on a factor and its overall market capitalization. Larger companies gain a greater weight even if their factor score is not as strong as other stocks in the parent index.
![]()
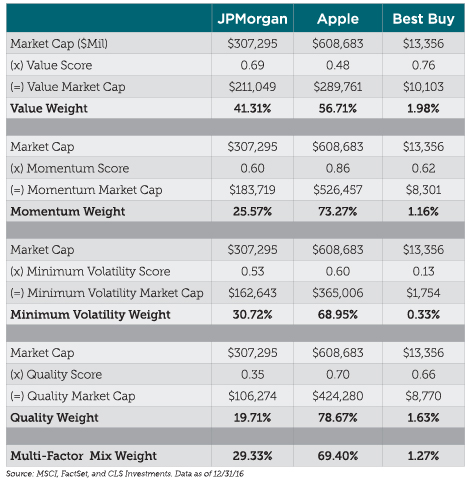
Sources: MSCI, FactSet, and CLS Investments. Data as of December 31, 2016
Factor-tilting takes a more bottoms-up approach by tilting towards various stocks based on their exposure to multiple factors simultaneously. This process involves combining each factor score multiplicatively to see what security holds up best to having representative exposure to each factor. As also illustrated below, this process tends to bias towards securities with higher factor scores across each factor, but still depends on each stock’s market-cap. In our example, Apple has strong factor scores for momentum, minimum volatility, and quality, and they nearly double the market-cap of JPMorgan.
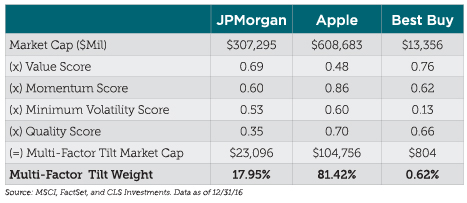
Sources: MSCI, FactSet, and CLS Investments. Data as of December 31, 2016
Both methods generally yield similar results. Under either method, eligible securities are measured based on how they stack up against other stocks in the entire investment opportunity set. This means the definition of one factor has no bearing on the definition of another and is assessed independently. Ultimately, stocks more likely to score high on multiple factor definitions tend to have a greater emphasis in the final index.
Although there may be more simplicity in this, it begs the question as to whether a typical active manager would make decisions in the same way. We explore this topic in the next section.
What Multi-Factor ETFs and Active Managers Don’t Have in Common
Another long-made argument in the ETF industry is that multi-factor ETFs put investors closer to investment exposures that compete directly against traditional active managers. Yes, capturing the same risk premiums that active managers incorporate at a fraction of the cost is a net benefit to end investors. And yes, active managers do use some form of factor investors in search of alpha through security selection.
But, do active managers pick stocks that simultaneously have the best value, quality, and momentum characteristics, for example? Absolutely not. In fact, many active managers identify pools of stocks that meet basic characteristics largely influenced by their investment philosophies and processes. They then refine those pools of securities based on fundamental, technical, valuation, and risk information that can lead to identifying the best and worst stocks to hold.
To illustrate this point, we’ll apply this process to determine what stocks should be included in a multi-factor index. We will assume we are value managers who prefer owning value stocks that also exhibit momentum, quality, and minimum-volatility characteristics. As value managers, we first want to find stocks that score reasonably well as value (defined as having a value score higher than 0.50). This one rule, by definition, should automatically eliminate 50% of the original index universe. Within this refined universe, we then determine multi-factor scores that reflect the likelihood we’ve identified value stocks with reasonable momentum, minimum volatility, and quality factor scores.