

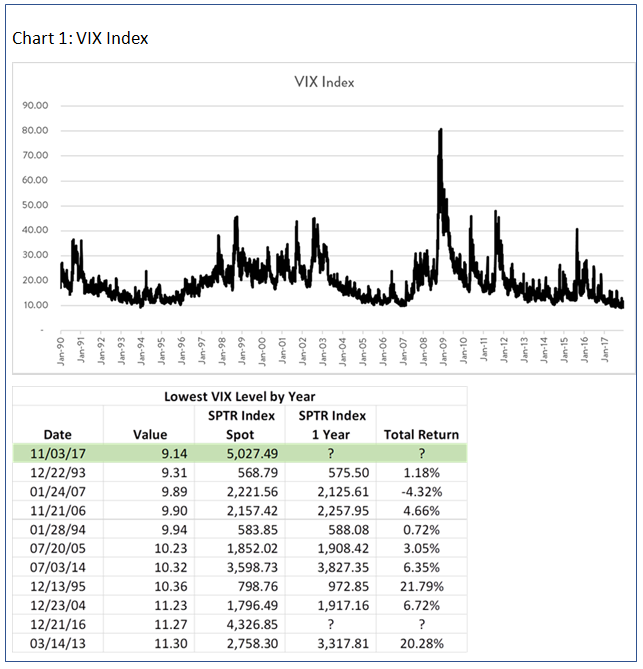
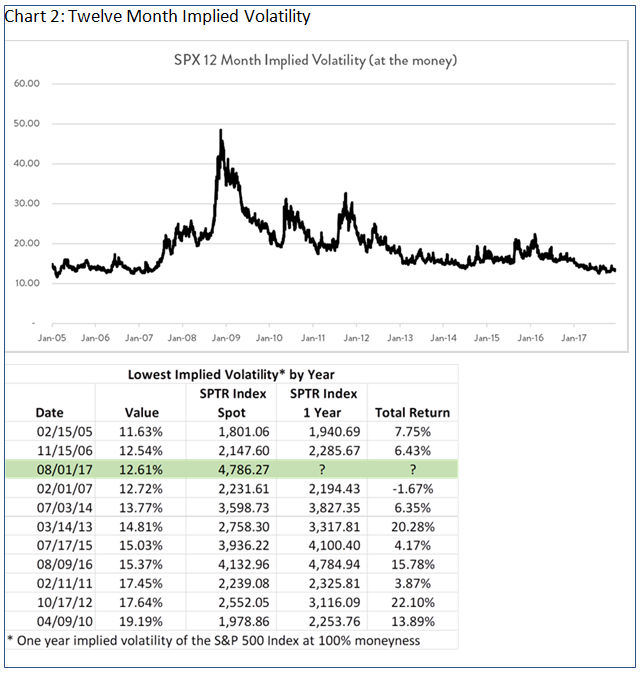
Large and institutional investors are still pricing in extremely low levels of future volatility as evidenced by the options trading market. This pricing level is supported by the historically low values of implied volatility for both short-term and long-term estimates. (Chart 1: VIX Index for short-term volatility metrics, and Chart 2: Twelve Month Implied Volatility).
![]()
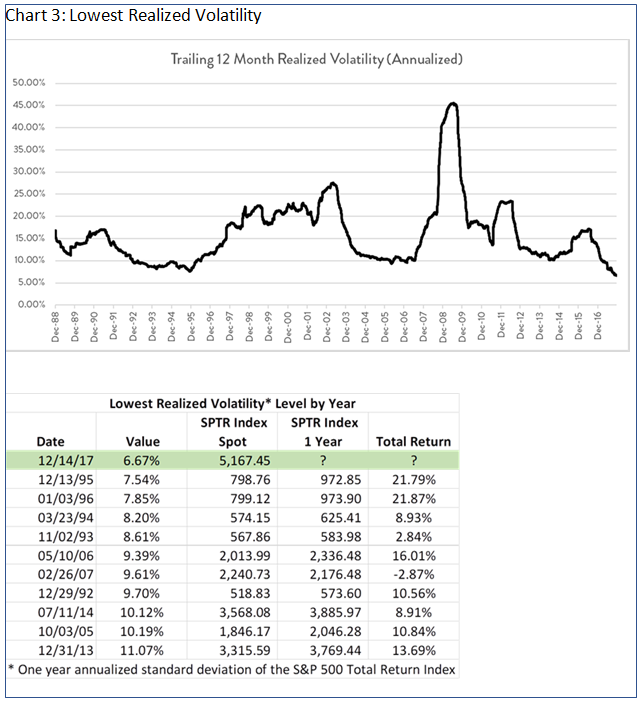
Another noteworthy observation is that the backward-looking realized market volatility has trended downward the past two years. As it happens, today we are experiencing historically low levels of realized volatility with a strong up-market. But, similar scenarios can be observed, in varying degrees, over the past twenty years (Chart 3: Lowest Realized Volatility).
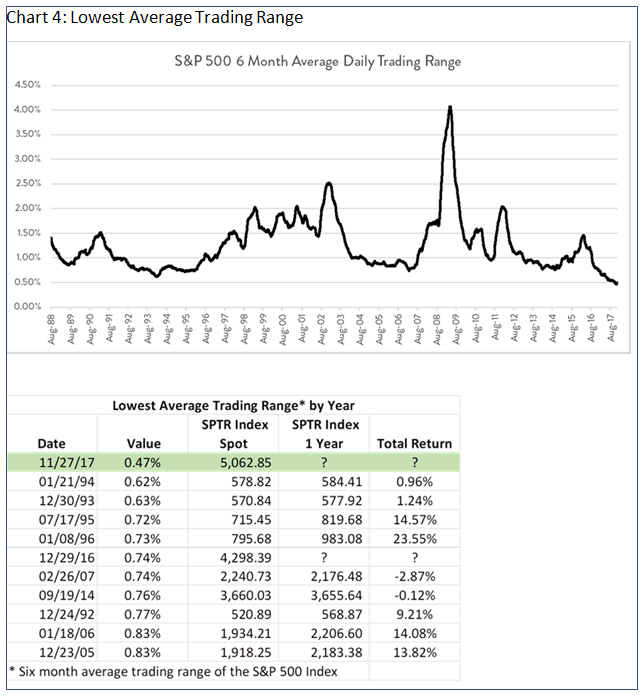
The last observation to support our viewpoint (Chart 4: Lowest Average Trading Range), shows that the intraday trading ranges of the S&P 500 Index have not bounced around very much recently. Our observations show that the intraday trading ranges have trended remarkably lower, from 1.50% to .52% over the past two years.
Conclusion
Here at Helios, we believe the historical evidence shows that staying the course is usually the best policy to build long-term wealth. This is especially true when dealing with our fear that trouble must be around the corner because the good-times are lasting too long!
This article was written by Joe Mallen and Chris Shuba of Helios Quantitative Research, a participant in the ETF Strategist Channel. Helios Quantitative Research provides financial advisors with the ability to offer state-of-the art, algorithm-driven asset management solutions to their clients on any platform. This helps advisors to:
- Provide clients a better asset management experience
- Reduce client fees by up to 30%
- Drive higher revenues by up to 50%