

Earlier this month, we discussed how ETF flows have historically responded to market downturns. That said, we did not anticipate the drawdown to return so violently, nor did we expect Volatility ETPs to be at the center of this sell off. This week, as requested by some ETF Think Tank members, we provide a more granular review of ETF flows post sell offs, and then a deep dive into what happened with Volatility ETPs.
In the last TETFindex update, we showed the flows of all US ETFs in the 3 months following any 6% monthly drop in the S&P 500. This prompted some ETF Think Tank members to ask which asset classes received those flows.
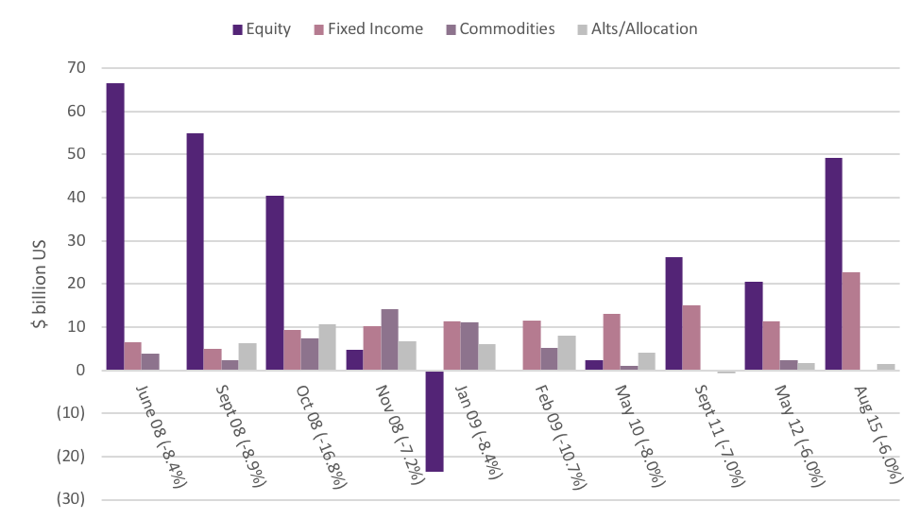
ETF FLOWS BY ASSET CLASS AFTER A DRAWDOWN
![]()
Source: Morningstar
As noted in the chart, ETF flows following a drawdown have been consistently positive across asset classes. The one exception is the market bottom in early 2009 where Equity ETFs saw about $23 Billion in outflows during the three months following an 8.4% drop in the S&P 500. We believe ETF flows will continue to respond positively to market drawdowns.
NOW ONTO VOLATILITY ETPs
As of 2-9-18, Volatility ETPs represent $4.05 billion of ETF assets down from $5.98 billion a week earlier. They represent a small but lucrative component of the ETF ecosystem. On Monday 2-5-18, two inverse volatility ETPs, for lack of better words, imploded. Toroso would like to share some of our thoughts on the headlines that have ensued and dispel some myths in the process.
#1- THIS HAS NEVER HAPPENED BEFORE!!!
FALSE
In 2011, an extremely similar ETN, iPath® Inverse S&P 500 VIX Short-Term FuturesTM ETN (IVO) was closed under extremely similar circumstances. So history has repeated, but the assets are substantially higher this time around.
#2- THIS IS A BLACK EYE FOR ETFS!!!
FALSE
The products traded orderly and did exactly what was described in the prospectus. Bloomberg has provided research contradicting the claims that this is an ETF issue.
