
By Marc Odo, Swan Global Investments
As part of an ongoing series trying to make sense of the broad, catch-all category called “liquid alternatives,” this post will explore one of the newest and most esoteric alternative strategies: volatility.
As has been the case in this series, we will discuss:
- What are the drivers of returns in this strategy?
- What are the risks of this strategy?
- What role does this strategy play within a portfolio?
- How does the given strategy compare to the Defined Risk Strategy?
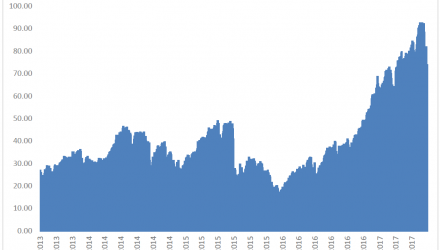
For most of 2017, volatility has been very subdued. The most frequently cited measure of volatility, the VIX, has been at levels not seen in a decade. The shrewd investor might try to capitalize on anticipated increases of market volatility by investing in one of the new volatility-based exchange traded products (ETP). There are over two dozen ETPs or mutual funds in the Morningstar database that attempt to capitalize on volatility in some shape or form, up from zero in 2009. This category includes long volatility and short volatility strategies, leveraged and unleveraged, ETNs and ETFs, and as of 8/21/2017 has an aggregate AUM exceeding $4.6 billion. They are used as hedging vehicles as well as speculative plays.
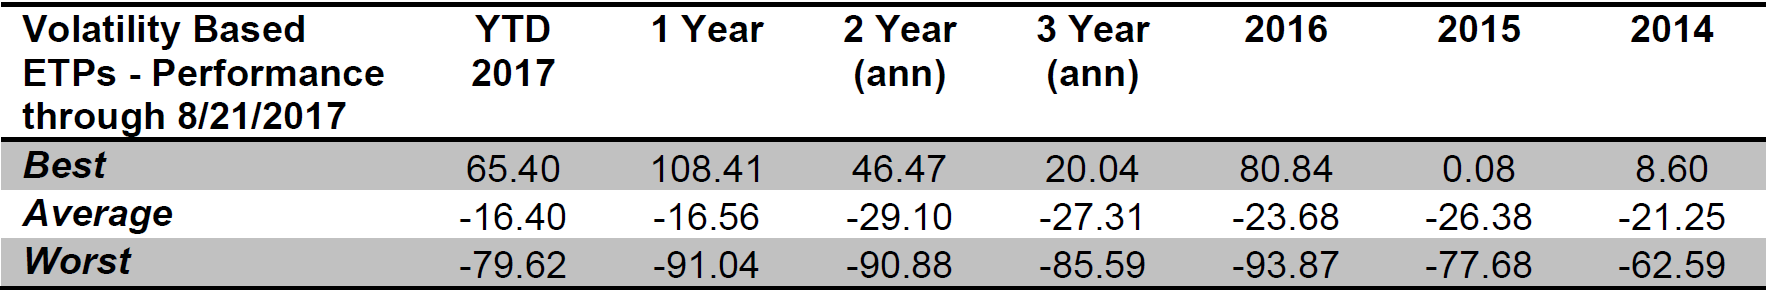
While betting on volatility might seem like a bright idea, it is much easier said than done. The unfortunate reality is the long-term performance of volatility-based ETPs has been atrocious. The average year-to-date return in the volatility category, through August 21st, 2017 has been -16.40%. Over the last three calendar years, the averages have been -23.68% (2016), -26.38% (2015) and -21.25% (2014). Why is this?
![]()
Source: Morningstar Direct
Drivers of Returns
A lot of the problem stems from the fact that most of these products are based on VIX futures, or futures on the CBOE Volatility Index. But just what exactly is the VIX? A lot of people commonly refer to the VIX as the “fear gauge” but that description leaves a lot to be desired. What is VIX actually measuring? How is it calculated?
When you get down to it, the VIX is calculated by inferring the implied volatility of the S&P 500, using the prices of a basket of short-term puts and calls on the S&P 500 as an indicator of market expectations for future volatility. While from an academic standpoint there is some logic to inferring future volatility from option prices, what the VIX actually measures are the supply and demand of short-term options.
Also, from a practical standpoint, the VIX is not an investable index. Unlike a standard stock index where one can simply purchase and hold the stocks in the proper weights, no one has yet devised a way to directly buy the VIX.
Instead, most products that try to capture the VIX movements do so via the use of short-term futures. Futures are of course another type of derivative, so a future on the VIX is really a derivative of a derivative. Futures have their own unique pricing complexities. In the case of VIX futures, the futures almost always trade at a premium to the VIX, a situation known in the futures market as “contango.” The term structure of futures resembles the yield curve, where typically the longer-dated securities are worth more than short-term securities.

Source: Swan Global Investments
Risks
Because these are short-term contracts, a VIX futures strategy must constantly be buying futures that are almost always more expensive today than they will be in the future. As the futures contract gets closer to delivery date they lose value, sliding down the curve. In order to maintain exposure in futures, this process is repeated again and again. In practical terms, this means consistently maintaining a position in VIX futures will almost always lose money.

Source: Swan Global Investments