

We are also emphasizing developed market equities, such as Europe and Japan. While domestic equities and emerging market stocks are trading at a premium to their historical average valuations, both Europe and Japan are trading at discounts. Emerging markets have surged this year, and we think their return expectations over the near-term should be lowered. As a result, emerging market stocks is one of our larger underweights.
Regarding our fixed income and alternative allocations, we think credit spreads are tight, so we pared back our exposure to corporate bonds. We have found several return enhancing and risk management opportunities in broadly diversified ETFs that blend allocations to REITs, MLPs, and dividend payers, as well as more focused holdings, like convertibles, bank loans, and preferreds. Again, without stretching for yield, our strategies can produce more income than the market.
In general, U.S. equities seem a little expensive to us, though we are interested in the sectors previously mentioned. We are also finding opportunities in Europe and Japan, where valuations remain attractive and economic fundamentals are improving. We are not long-term bulls on either region, but find them favorable for the time being.
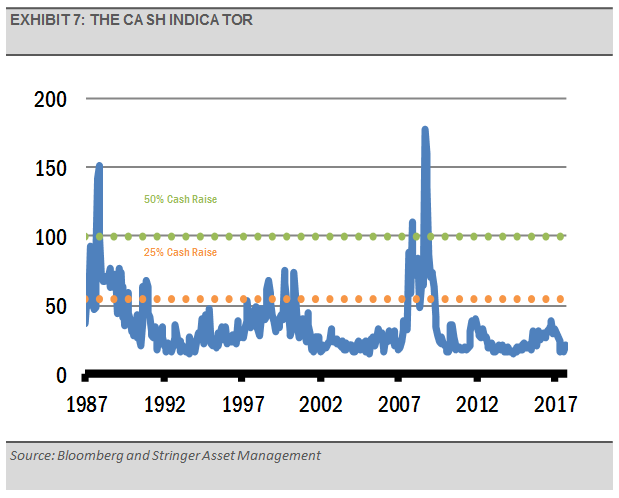
THE CASH INDICATOR
The Cash Indicator (CI) has declined to the low end of its historic range. While we expect market volatility to increase, the current level of the CI suggests that the environment for raising significant cash is a long way off.
This article was written by Gary Stringer, CIO, Kim Escue, Senior Portfolio Manager, and Chad Keller, COO and CCO at Stringer Asset Management, a participant in the ETF Strategist Channel.
DISCLOSURES
Any forecasts, figures, opinions or investment techniques and strategies explained are Stringer Asset Management, LLC’s as of the date of publication. They are considered to be accurate at the time of writing, but no warranty of accuracy is given and no liability in respect to error or omission is accepted. They are subject to change without reference or notification. The views contained herein are not be taken as an advice or a recommendation to buy or sell any investment and the material should not be relied upon as containing sufficient information to support an investment decision. It should be noted that the value of investments and the income from them may fluctuate in accordance with market conditions and taxation agreements and investors may not get back the full amount invested.
Past performance and yield may not be a reliable guide to future performance. Current performance may be higher or lower than the performance quoted.
The securities identified and described may not represent all of the securities purchased, sold or recommended for client accounts. The reader should not assume that an investment in the securities identified was or will be profitable.
Data is provided by various sources and prepared by Stringer Asset Management, LLC and has not been verified or audited by an independent accountant.
Index Definitions:
S&P 500 Index – This Index is a capitalization-weighted index of 500 stocks. The Index is designed to measure performance of a broad domestic economy through changes in the aggregate market value of 500 stocks representing all major industries.
Russell 3000 Growth – This Index is a market capitalization weighted index based on the Russell 3000 index. The Russell 3000 Growth Index includes companies that display signs of above average growth. The index is used to provide a gauge of the performance of U.S. growth stocks.
Russell 3000 Value – This Index is a market capitalization weighted index based on the Russell 3000 index. The Russell 3000 Value Index includes companies that display lower price-to-book ratios and lower expected growth rates.