
Now that 2020 has drawn to a close, I’m revisiting my most popular investment posts of the year, based on views. It was a truly historic 12 months, to say the least, but I won’t be covering everything that happened.
For many of you, that’s probably a good thing.
So without further ado, below are the top five most read stories of 2020, in descending order.
5. Should You Buy the Panic?
from March 16
The U.S. reported its first case of the novel coronavirus on January 20, 2020, and in less than two months, economic activity came to a screeching halt. In March alone, the number of passengers boarding commercial flights in the U.S. plummeted from 2.3 million per day to under 150,000. The shock was enough to sink stocks more than 30% from their highs, bringing an end to the historic bull market.
In this Frank Talk from mid-March, I asked whether investors should buy the panic. At the time, many may have thought it too early to begin bargain hunting, but there were compelling signs that it was now or never.
Our very own U.S. Global Sentiment Index, which tracks a variety of asset classes, fell to an all-time low on March 18, indicating an unprecedented buy signal. Global airline stocks became most oversold since September 2001, following the attacks on 9/11, and we saw millennial Robinhood investors gobble up shares, even as Warren Buffett sold his airline holdings.
4. Gold Is Within Striking Distance of Its All-Time High. Here’s How to Play the Rally
from July 23
When this post was published in late July, gold had just touched an all-time high in intraday trading. The record high closing price of $2,070 an ounce wouldn’t come until August 6, but at the time, I wrote that my favorite way to play the historic stimulus-driven rally was with gold royalty stocks.
I also commented on the blistering tech rally that’s seen firms as diverse as PayPal Holdings, Nvidia and Etsy end the year up by triple digits.
And the top S&P 500 of 2020 (by far)? Newcomer Tesla, which has increased by more than 700% year-to-date.
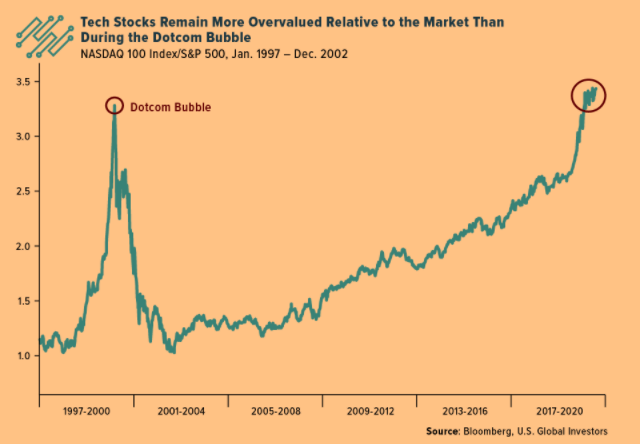
Tech stocks, as measured by the NASDAQ 100, are now more overvalued relative to the market than at any other time since the dotcom bubble. Will the rally continue into 2021?
3. Is the Gold Rally Overdone? Here’s What History Says May Come Next
from July 29
In this post, I looked at all the instances when gold exceeded 85 on the 14-day relative strength index (RSI), going back to 1980. Gold was beginning to look extremely overbought in late July, and I wanted to see what might come next.
By my count, there have been only 16 times since 1980 when gold was this overdone.
What I found was that, between 1980 and 1999, the price of gold slumped in the months after it exceeded 85.
That trend seemed to reverse during the next 20 years. Between 2000 and 2020, the precious metal actually rose in the months after it broke above 85.
So what changed? Near-zero interest rates. Between 1980 and 1999, the yield on the 10-year Treasury averaged 8.6%. Between 2000 and 2020, it averaged 3.3%.
However, as we all know, past performance is not guarantee of future results. Here we are five months later, and the price of gold is down from where it was in late July.
2. These U.S. Companies Have the Highest Debt-to-Equity Ratios Right Now
from April 1
U.S. companies entered the pandemic with an historic amount of debt—nearly $10 trillion, close to half the size of the economy. And with credit downgrades looming, lower-quality, BBB-rated debt was already at an elevated share of the investment-grade universe.
I was curious to see which S&P 500 companies had the most debt on their books relative to equity before markets began to tumble due to the spring lockdowns. As of December 31, 2019, the S&P as a whole had a debt-to-equity ratio of 1.58%, meaning that for every $1 they had in case and other assets, they had $1.58 in liabilities.
So which companies were shouldering the greatest relative debt? Click here to see the top 10.
1. These Are My 10 Favorite Junior Mining Companies
from November 10
And now we come to it—the most read investment story of 2020, based on views.
In November, I cohosted the Virtual Junior Mining Expo with my friends at Streetwise Reports, and to generate some anticipation for the event, I introduced the 10 junior mining firms that were slated to participate. The largest among them was Gran Colombia, which at the time had a market cap of $305 million.
If you missed the virtual event the first time, you can still watch the replay, available here.
Happy New Year! Here’s to buckets of wealth and prosperity in 2021!
Originally published by US Funds, 12/30/20
All opinions expressed and data provided are subject to change without notice. Some of these opinions may not be appropriate to every investor. Some links above may be directed to third-party websites. U.S. Global Investors does not endorse all information supplied by these websites and is not responsible for their content.
The S&P 500 Stock Index is a widely recognized capitalization-weighted index of 500 common stock prices in U.S. companies. The NASDAQ-100 Index is a modified capitalization-weighted index of the 100 largest and most active non-financial domestic and international issues listed on the NASDAQ.
The relative strength index (RSI) is a momentum indicator used in technical analysis that measures the magnitude of recent price changes to evaluate overbought or oversold conditions in the price of a stock or other asset.
A bond’s credit quality is determined by private independent rating agencies such as Standard & Poor’s, Moody’s and Fitch. Credit quality designations range from high (AAA to AA) to medium (A to BBB) to low (BB, B, CCC, CC to C).
Holdings may change daily. Holdings are reported as of the most recent quarter-end. The following securities mentioned in the article were held by one or more accounts managed by U.S. Global Investors as of (9/30/2020): Tesla, Inc.