By Marc Odo, Swan Global Investments
In a previous blog post, “The Importance of Avoiding Large Losses,” we discussed the impacts of large losses on portfolios and wealth creation. Certainly anyone who lived through the dot-com crash of 2000-02 or the financial crisis of 2007-09 is well aware of the damage losses of 30%, 40% or 50% can have on a portfolio.
What many people don’t know, however, is the impact that volatility has on the long-term success of an investment plan. If bear markets can be described as a rare but catastrophic flood, everyday volatility can be thought of as water damage slowly eroding away the foundations of your house.
Investment returns are often stated as long-term averages. The problem with averages, however, is that averages mask details. The day-to-day or month-to-month experience of an investor might be radically different from the long-term averages. What happens in-between might have a large impact on the final wealth of an investor.
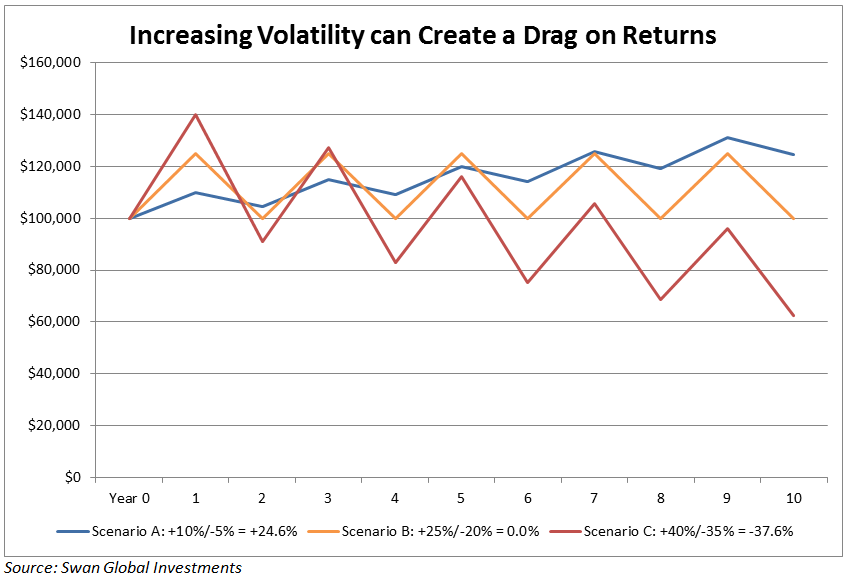
Again, we start with a simple illustration. If one were asked which of the following three scenarios would yield the best ten-year results, one might be tempted to choose the last of these three options:
- Up 10% one year, down 5% the next, repeated for ten years
- Up 25% one year, down 20% the next, repeated for ten years
- Up 40% one year, down 35% the next, repeated for ten years
In fact, the opposite is true. After a decade:
- Scenario A, with its most modest gains and losses, performs best and is the only scenario that is profitable;
- Scenario B breaks even and;
- Scenario C loses money.
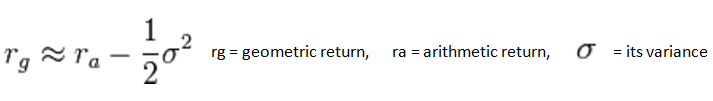
This phenomenon is known as volatility drag. Also called variance drain, volatility drag was detailed in a 1995 paper by Tom Messmore titled “Variance Drain – Is your return leaking down the variance drain?”. Messmore observed that the more variable a given asset’s return is, the greater the difference between the arithmetic and geometric returns.
- Arithmetic mean is the average of a set of numerical values, calculated by adding together and dividing by the number of terms in the set (Source: Wikipedia).
- Geometric mean is defined as the value of a set of numbers by using the product of their values, as opposed to the arithmetic mean which uses their sum (Source: Wikipedia).
Formula of Variance Drain