
Managing Director, Global Head of Product Management, from Indexology Blog
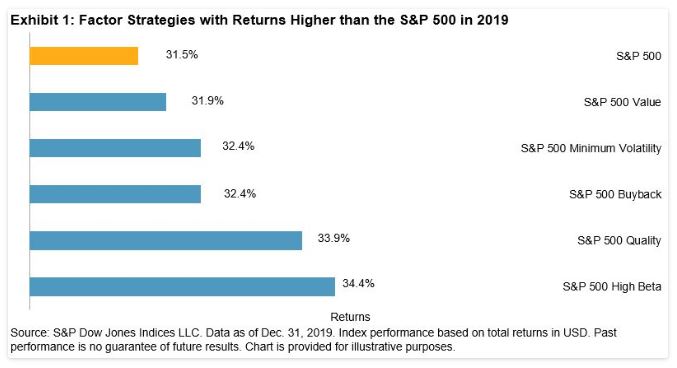
In 2019, U.S. equities posted double-digit gains, with the S&P 500® returning 31.49%—its best year since 2013 and second-best in a decade. This continued strong performance highlights the potential difficulty of beating the S&P 500.[1] The question then arises: what strategy (if any) outperformed the S&P 500 in 2019?
Our latest S&P 500 Factor Indices Dashboard details the performance of various passive factor strategies across multiple time horizons. Five factor-based strategies outperformed the S&P 500 in 2019—high beta, quality, buyback, minimum volatility, and value (see Exhibit 1).
We focus on quality—the second-best-performing factor—in this blog. High beta, by definition, tends to deliver higher returns than the broad market in a bullish environment. Because of this, its standing as the best-performing factor in 2019 comes as no surprise. Quality, on the other hand, is a frequently debated factor for which definitions can vary greatly and performance can be cyclical.[2] Therefore, its outperformance in 2019 merits additional insight and analysis.
S&P DJI’s definition of high-quality companies is consistent with Graham and Dodd’s definition of “sustainable earnings power.”[3] We measure quality as a composite score of profitability (ROE), low earnings accruals, and prudent usage of leverage (debt/equity). Back-testing, as well as live performance data, show that over a long-term investment horizon, higher-quality companies in the S&P 500 outperformed lower-quality companies and the broad market on both an absolute and risk-adjusted return basis.[4]
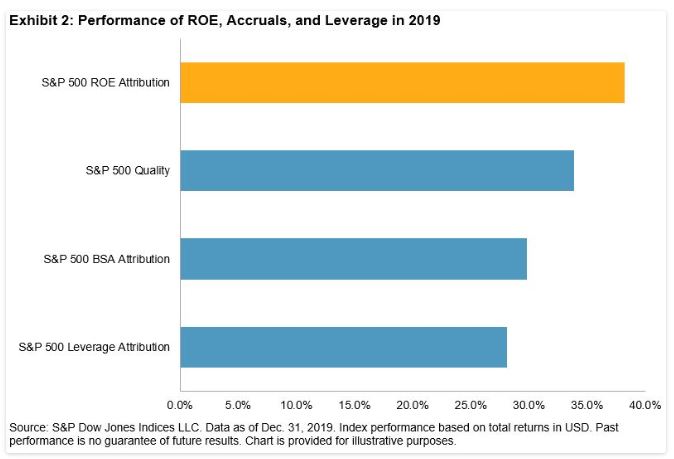
Given that the S&P 500 High Quality Index comprises three fundamental ratios, we sought to understand which ratio contributed the most to the index returns. Exhibit 2 shows the performance of each of the underlying ratios—ROE, accruals, and debt-to-equity—in 2019.
The market rewarded profitable companies handsomely in 2019. ROE was the best-performing ratio of the three (38.2%), followed by accruals (29.8%), and then leverage (28.1%). In fact, the portfolio of the highest ROE companies outperformed the S&P 500 by nearly 670 bps.
Given quality’s performance against the S&P 500 in 2019, we wanted to dig deeper into multi-factor strategies that incorporate elements of quality in their index construction. For instance, the S&P 500 GARP Index—which combines growth, value, and quality scores to arrive at a portfolio of 75 growth securities with relatively high earnings quality and reasonable valuations—kept pace with the S&P 500 in 2019, returning 31.5%. On the other hand, the S&P 500 Quality, Value & Momentum Multi-Factor Index lagged the S&P 500 and returned 26.2%. The index’s underperformance is partly driven by exposure to the momentum factor (26.25%), which returned less than the broad market in 2019.
In sum, 2019 was a strong year for domestic equities. The S&P 500, a market barometer for large-cap U.S. equities, posted its second-best year in a decade. Quality was one of the few factors that managed to deliver higher returns than the S&P 500. Upon deeper examination, we found that profitability was the biggest return contributor to the quality factor, posting significantly higher returns than the S&P 500. While it may seem like 2019 was a difficult period to beat the S&P 500, our blog highlights that passive factor strategies with exposure to quality performed even better than the S&P 500 in 2019.
[1] Chris Bennett, “https://www.indexologyblog.com/2020/01/07/from-hard-to-beat-to-nigh-on-impossible/”
[2] Aye Soe, “https://www.indexologyblog.com/2018/05/23/quality-part-i-defining-the-quality-factor/”
[3] Daniel Ung, Priscilla Luk, and Xiaowei Kang. “Quality: A Practitioner’s Guide?”. S&P Dow Jones Indices.
[4] ibid.