By David Schassler, Portfolio Manager for VanEck
The VanEck Vectors® Real Asset Allocation ETF (RAAX®) uses a data-driven, rules-based process that leverages over 50 indicators (technical, macroeconomic and fundamental, commodity price, and sentiment) to allocate across 12 individual real asset segments in five broad real asset sectors. These objective indicators identify the segments with positive expected returns. Then, using correlation and volatility, an optimization process determines the weight to these segments with the goal of creating a portfolio with maximum diversification while reducing risk. The expanded PDF version of this commentary can be downloaded here.
Overview
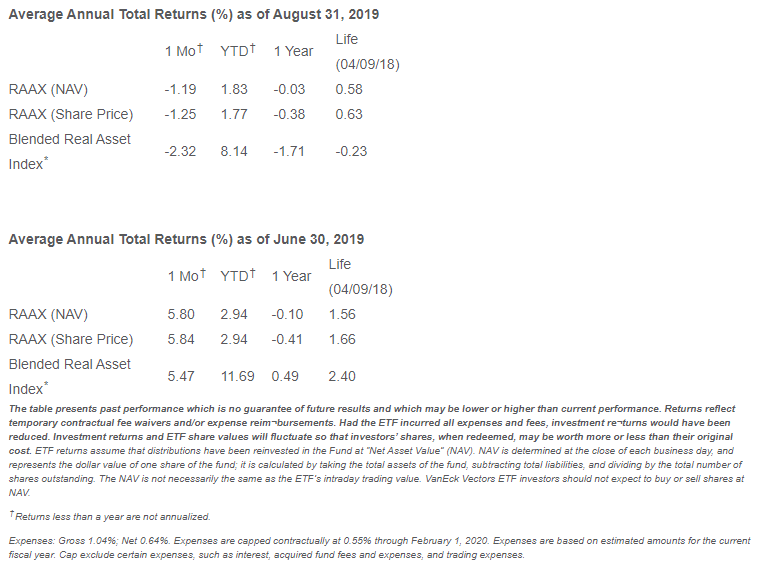
The VanEck Vectors Real Asset Allocation ETF (RAAX) returned -1.19% in August. By comparison, its blended benchmark and the Bloomberg Commodity Index returned -2.32%. RAAX relied on diversification to provide stability during a period of heightened volatility. It was, and remains, well-diversified across gold, natural resource equities, REITs, global infrastructure and MLPs. RAAX’s top-performing assets were gold and gold equities, up 7.80% and 12.68%, respectively. Many of the interest-sensitive real assets were another bright spot in the portfolio as REITs and global infrastructure returned 3.75% and 0.46%, respectively. The worst performing assets were in certain natural resource equities. Oil service equities were down -20.46%, steel equities were down -12.63%, and unconventional oil and gas equities were down -11.46%.
Risk remains elevated due to the trade war with China and uncertainties about future monetary policy. Globally, risk is up and, in response, interest rates are down. This has been boding well for gold and real assets with attractive yields. Conversely, it hasn’t been great for many other commodities and natural resource equities.
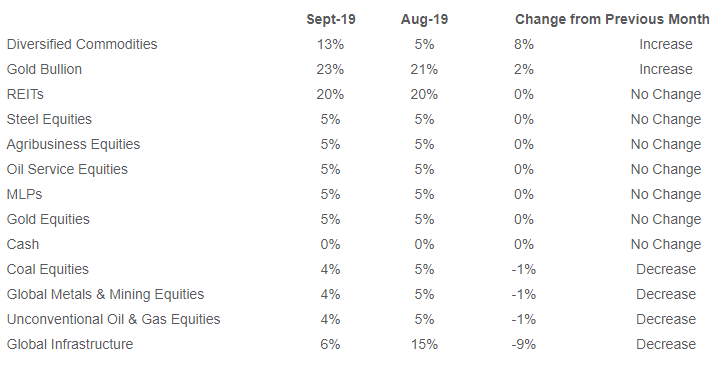
RAAX remains well diversified across real asset investments in September. The only notable allocation shift from August was a reduction in global infrastructure, due to the rising volatility and correlation profile of the asset class, with the proceeds going to diversified commodities.
A Deeper Dive
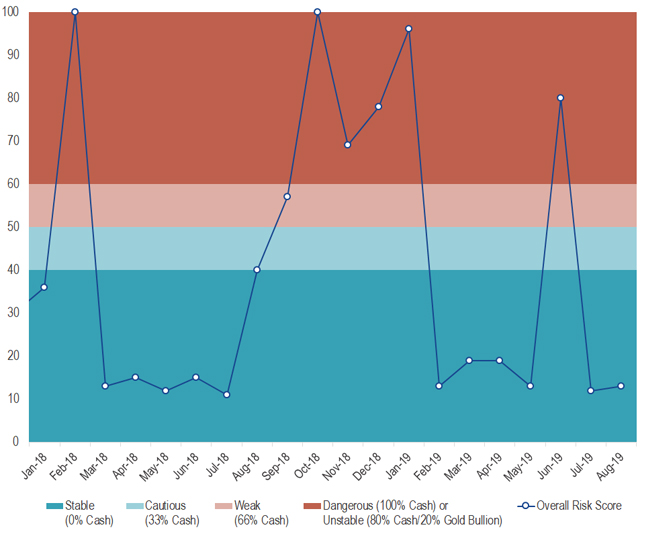
Below is the overall real asset economic composite. A score of 0 represents the lowest risk level and a score of 100 represents the highest risk level. A score of 60 or higher will result in our most defensive posture. This is now the second month in a row with a stable risk score.
Overall Risk Score
The risk score can be decomposed into key factors that drive real asset prices. These include price trends, economic activity, commodity prices, realized volatility, economic activity, and investor sentiment.
Price Trend Risk Score

Price trends, in the aggregate, are bearish, but those negative trends are concentrated in natural resource equities. Many other real assets are performing just fine.
Economic Risk Score
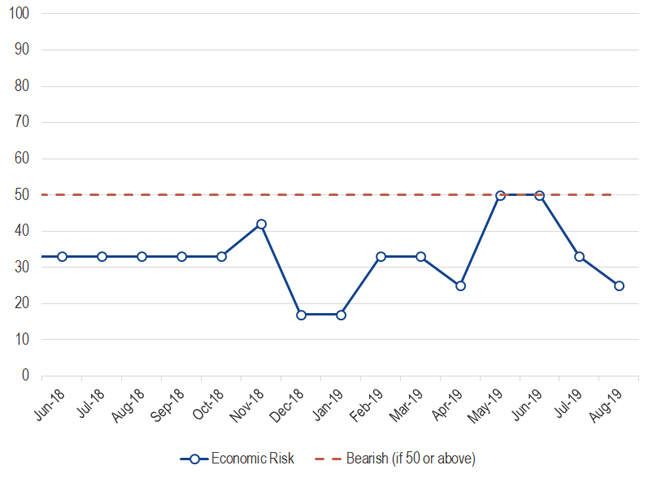
Economic activity became bullish in June and continues to be supportive of real asset prices.
Price Volatility Risk Score

While volatility has ticked up lately, it’s not yet at extreme levels. Volatility extremes are often associated with rapid declines in prices, and that’s not the case yet.
Investor Sentiment Risk Score
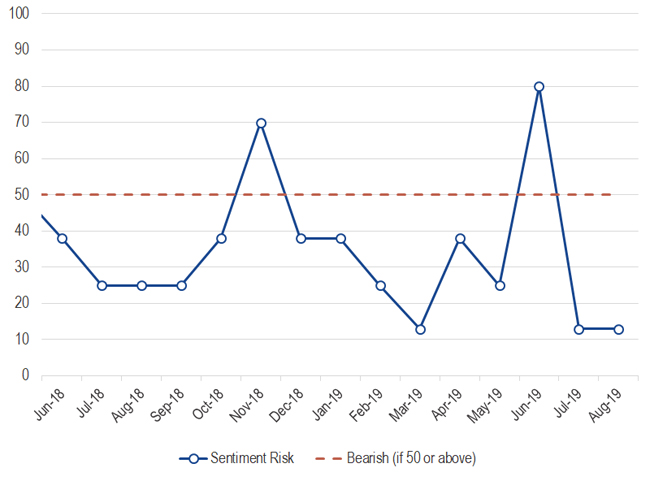
Investor sentiment, within commodities, is not at an extreme.
Commodity Price Risk Score

Commodity price trends, in aggregate, are still bearish. Those bearish trends are most clear in the energy sector.
To conclude, real asset risks are elevated. Weakness in the energy sector is weighing heavily on commodities and natural resource equities. Other commodity prices are mixed. The real assets with hearty yields have benefited from the expectations of lower future interest rates. And gold continues to be a top-performing asset, not just within real assets, but across all assets. RAAX will continue to seek to safeguard against downside pressure in prices through diversification while remaining fully invested to participate in upside moves.
Real Asset Class Allocations