By James Kim, VanEck Director, ETFs
For some time now, we have been studying different trading opportunities associated directly, or indirectly, with VanEck Vectors® ETFs. We have identified a number that we think may be of interest to our clients. Consequently, we have decided to launch a series of occasional pieces that offer investors what we believe may be interesting trading ideas around our ETFs.
With each new trade idea, we will also provide monthly updates on either how a previously executed trade (which is still “open”) is faring, or how previous trades (which have been executed and “closed”) have done. This will, we hope, provide investors some useful continuity around the trades we have described.
Trade Idea: A long position in VanEck Vectors® Fallen Angel High Yield Bond ETF (ANGL).
Rationale
At the end of July, the U.S. Federal Reserve (Fed) cut its overnight lending rate 25 bps from 2.25% to 2.00%. Despite some wild fluctuations, in the end, credit markets did not react that much to the Federal Open Market Committee’s (FOMC’s) cut. Investors in high yield bonds will, however, be congratulating themselves.
Based on the tone of the FOMC’s most recent statement, fed fund futures are pricing in 114 bps of additional cuts by the end of 2020—up from the 70 bps before the July FOMC meeting.
Federal Funds Rate Implied by Futures
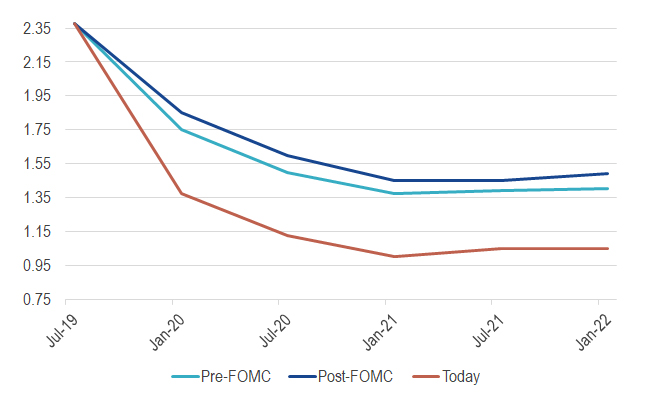
Source: Source: Bloomberg and Goldman Sachs
We believe this is most likely only going to increase as trade tensions and the threat of a global slowdown persist. With President Donald Trump threatening to lift tariff rates “well beyond 25%” (if necessary), the U.S. Department of the Treasury designating China as a currency manipulator, China suspending purchases of U.S. agricultural goods and elsewhere the threat of a “no-deal” Brexit, the scene appears to be well set for a potential “mid-cycle adjustment” to “adjust policy to a somewhat more accommodative stance:” as per Fed Chairman Jerome Powell.
It does not look as if the Fed is interested in popping any asset bubbles in the riskier end of the market, in our opinion, rather, yields look to be heading back down to the lows reached in July. Even if they remain at these levels, 10-year U.S. Treasuries are yielding approximately 1.47% (as of August 28, 2019). We believe this may mean better returns from higher-yielding U.S. debt for the rest of the year.
Why specifically ANGL? As William Sokol alludes to in his recent post, “Fallen Angel High Yield Bonds in the Late Cycle,” two primary factors that have led to the outperformance of fallen angels over its broad market competitors.
- Longer Duration: As a general rule of thumb, for every 1% increase/decrease in interest rates, there should be a 1% decrease/increase in price (remember bond prices and interest rates are inversely related) for every one year in duration. In a falling interest rate environment, ANGL’s higher duration (6.215 based on aggregate cash flow (ACF) methodology[1]) should lead it to outperform relative to its broad high-yield peers. Fallen angel bonds generally have an average higher duration because of their previous status as an investment-grade issuer; because of their fundamentals, investment-grade issuers can generally obtain longer-term funding.
- Credit Selection: From the universe of high yield bonds, the higher quality names (i.e. BB) have outperformed the lower quality names (i.e. B, CCC and lower). ANGL’s tilt towards BB exposure (~75%) has helped outperform its peers in the broad high yield space since mid-May of this year.
Given this, there seem to be few reasons, in our opinion, why the performance of high yield bonds should not surpass that of either leveraged loans or, indeed, investment-grade debt in the second half of the year. While high yield bonds may have lost out to equities in the first half of the year, weak earnings could now be a drag on equity returns. We believe that, with few signs of rising defaults, the returns from high yield should remain solid for some time yet.
The VanEck Vectors®Fallen Angel High Yield Bond ETF (ANGL) seeks to replicate as closely as possible, before fees and expenses, the price and yield performance of the ICE BofAML US Fallen Angel High Yield Index (H0FA), which is comprised of below investment grade corporate bonds denominated in U.S. dollars, issued in the U.S. domestic market and that were rated investment grade at the time of issuance.
For more market trends, visit ETF Trends.
IMPORTANT DISCLOSURES
[1] Aggregated cash flow (ACF) methodology is a way of calculating yield and duration for fixed income ETFs.
Past performance is not a guarantee of future results. Performance current to the most recent month end is available by calling 800.826.2333 or on this web page.
This is not an offer to buy or sell, or a solicitation of any offer to buy or sell any of the securities mentioned herein. The information presented does not involve the rendering of personalized investment, financial, legal, or tax advice. Certain statements contained herein may constitute projections, forecasts and other forward looking statements, which do not reflect actual results, are valid as of the date of this communication and subject to change without notice. Information provided by third party sources are believed to be reliable and have not been independently verified for accuracy or completeness and cannot be guaranteed. The information herein represents the opinion of the author(s), but not necessarily those of VanEck.
An investment in the VanEck Vectors®Fallen Angel High Yield Bond ETF (the Fund) may be subject to risk which includes, among others, high yield securities, foreign securities, foreign currency, credit, interest rate, restricted securities, market, operational, call, sampling, basic materials, energy, financial services, telecommunications, index tracking, authorized participant concentration, no guarantee of active trading market, trading issues, passive management, fund shares trading, premium/discount and liquidity of fund shares and concentration risks, all of which may adversely affect the Fund.
ICE Data Indices, LLC and its affiliates (“ICE Data”) indices and related information, the name “ICE Data”, and related trademarks, are intellectual property licensed from ICE Data, and may not be copied, used, or distributed without ICE Data’s prior written approval. The licensee’s products have not been passed on as to their legality or suitability, and are not regulated, issued, endorsed, sold, guaranteed, or promoted by ICE Data. ICE Data MAKES NO WARRANTIES AND BEARS NO LIABILITY WITH RESPECT TO THE INDICES, ANY RELATED INFORMATION, ITS TRADEMARKS, OR THE PRODUCT(S) (INCLUDING WITHOUT LIMITATION, THEIR QUALITY, ACCURACY, SUITABILITY AND/OR COMPLETENESS).
Index returns are not Fund returns and do not reflect any management fees or brokerage expenses. Certain indices may take into account withholding taxes. Investors can not invest directly in the Index. Returns for actual Fund investors may differ from what is shown because of differences in timing, the amount invested and fees and expenses. Index returns assume that dividends have been reinvested.
ICE BofAML US Fallen Angel High Yield Index (H0FA, “Index”), formerly known as BofA Merrill Lynch US Fallen Angel High Yield Index prior to 10/23/2017, is a subset of the ICE BofAML US High Yield Index (H0A0, “Broad Index”), formerly known as BofA Merrill Lynch US High Yield Index prior to 10/23/2017), including securities that were rated investment grade at time of issuance. H0FA is not representative of the entire fallen angel high yield corporate bond market.
Fund shares are not individually redeemable and will be issued and redeemed at their NAV only through certain authorized broker-dealers in large, specified blocks of shares called “creation units” and otherwise can be bought and sold only through exchange trading. Shares may trade at a premium or discount to their NAV in the secondary market. You will incur brokerage expenses when trading Fund shares in the secondary market. Past performance is no guarantee of future results. Returns for actual Fund investments may differ from what is shown because of differences in timing, the amount invested, and fees and expenses.
The “Net Asset Value” (NAV) of a VanEck Vectors Exchange Traded Fund (ETF) is determined at the close of each business day, and represents the dollar value of one share of the fund; it is calculated by taking the total assets of the fund, subtracting total liabilities, and dividing by the total number of shares outstanding. The NAV is not necessarily the same as the ETF’s intraday trading value. VanEck Vectors ETF investors should not expect to buy or sell shares at NAV.
Investing involves substantial risk and high volatility, including possible loss of principal. Bonds and bond funds will decrease in value as interest rates rise. An investor should consider the investment objective, risks, charges and expenses of the Fund carefully before investing. To obtain a prospectus and summary prospectus, which contains this and other information, call 800.826.2333 or visit vaneck.com. Please read the prospectus and summary prospectus carefully before investing.