

Regarding our fixed income and alternative allocations, tight credit spread and low interest rates continue to create a challenging environment for traditional fixed income investors. Our well diversified, strategic/tactical approach has allowed us to take advantage of several return-enhancing and risk management opportunities in broadly diversified ETFs that blend allocations to REITs, MLPs, and dividend payers, as well as more focused holdings, like convertibles, bank loans, and preferreds.
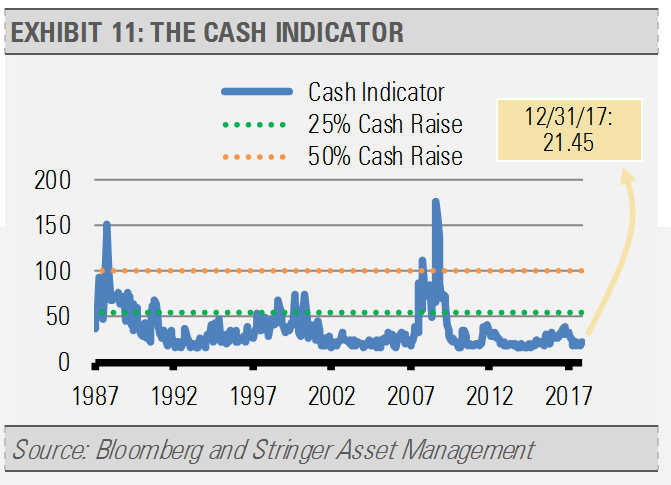
THE CASH INDICATOR
The Cash Indicator (CI) has moved up slightly, but is still a long way from signaling significant equity market risk ahead (exhibit 11). Keeping in mind that the Cash Indicator is a measure of fear and volatility in both equity and credit markets, the low volatility environment has us fully invested. The CI is supportive of our base case for slow and steady growth. At these levels, we see any near-term volatility as healthy and necessary for global markets to continue their upward trend.
DISCLOSURES
Any forecasts, figures, opinions or investment techniques and strategies explained are Stringer Asset Management, LLC’s as of the date of publication. They are considered to be accurate at the time of writing, but no warranty of accuracy is given and no liability in respect to error or omission is accepted. They are subject to change without reference or notification. The views contained herein are not be taken as an advice or a recommendation to buy or sell any investment and the material should not be relied upon as containing sufficient information to support an investment decision. It should be noted that the value of investments and the income from them may fluctuate in accordance with market conditions and taxation agreements and investors may not get back the full amount invested.
Past performance and yield may not be a reliable guide to future performance. Current performance may be higher or lower than the performance quoted.
The securities identified and described may not represent all of the securities purchased, sold or recommended for client accounts. The reader should not assume that an investment in the securities identified was or will be profitable.
Data is provided by various sources and prepared by Stringer Asset Management, LLC and has not been verified or audited by an independent accountant.
Index Definitions:
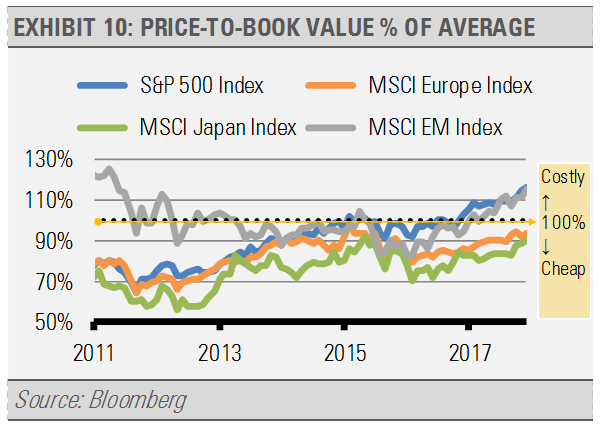
S&P 500 Index – This Index is a capitalization-weighted index of 500 stocks. The Index is designed to measure performance of a broad domestic economy through changes in the aggregate market value of 500 stocks representing all major industries.
MSCI Europe Index – This Index captures large and mid cap representation across 15 Developed Markets (DM) countries in Europe. With 445 constituents, the index covers approximately 85% of the free float-adjusted market capitalization across the European Developed Markets equity universe.
MSCI Japan Index – This Index is designed to measure the performance of the large and mid cap segments of the Japanese market. With 321 constituents, the index covers approximately 85% of the free float-adjusted market capitalization in Japan.
MSCI EM Index – This Index captures large and mid cap representation across 24 Emerging Markets (EM) countries. With 837 constituents, the index covers approximately 85% of the free float-adjusted market capitalization in each country.
This article was written by Gary Stringer, CIO, Kim Escue, Senior Portfolio Manager, and Chad Keller, COO and CCO at Stringer Asset Management, a participant in the ETF Strategist Channel.