
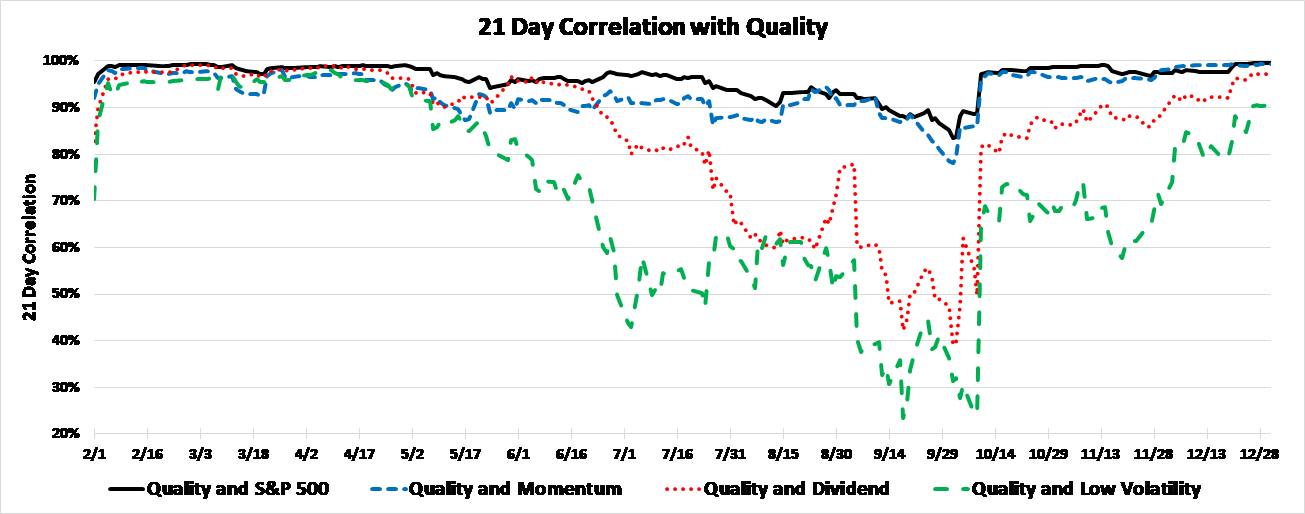
We are particularly struck by the close correlation between High Quality and Momentum in Chart 3, compared to the lower correlation between Quality and the two defensive factors. Momentum is a bullish-aggressive factor, while Quality is conservative and defensive, yet they tracked closely through the year. Except for the market’s topping process in late summer, the correlation between Quality and Momentum remained above 90%. The correlation nearly reached 100% in the December slump, leaving Quality buyers wondering what happened to their diversified portfolios! The old adage says that in a bear market, all correlations go to one. It appears that Quality—and the other defensive factors—fell victim to this phenomenon in the fourth quarter.
Chart 3
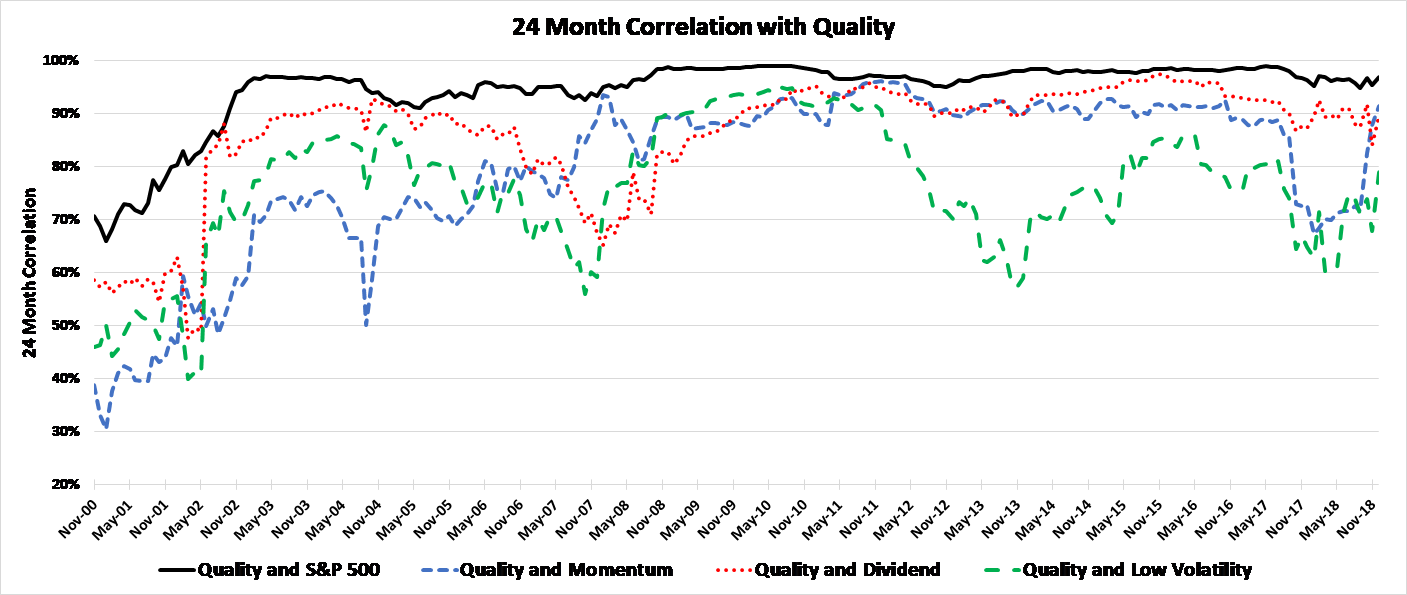
We examined longer-term trends in factor correlations to see if this was an unusual year, with the results shown in Chart 4. Factor diversification was robust before the 2008 bear market but coming out of that traumatic period we see Quality moving closely with both Dividends and Momentum.
Chart 4
Sector Weights
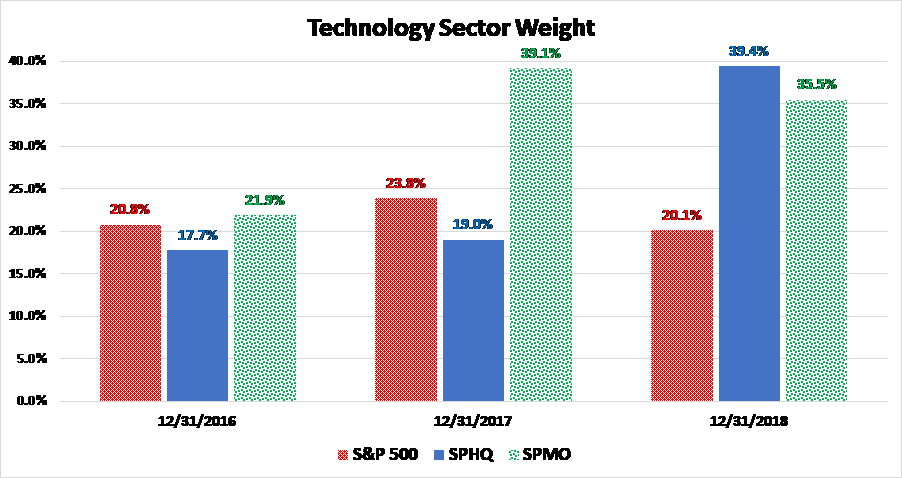
This year’s close correlation between Quality and Momentum led us to investigate whether the Technology sector provided a common link between the two factors, and the answer was a resounding yes. Using the SPHQ ETF to represent the S&P 500 Quality Index, we found that Technology was just 17.7% of the portfolio weight at the end of 2016. However, by year-end 2018, SPHQ held 39.4% in Technology, almost double the S&P 500 parent index and even outpacing the S&P 500 Momentum Index, represented by SPMO (Chart 5). The incredible business success of cloud computing giants made them eligible to join the High-Quality club, and the index holds several Tech titans including Microsoft, Visa, Mastercard, Nvidia, Cisco, Adobe, and Apple.
Chart 5
Defining Quality
Analysts often measure the Quality of common stocks by using a blend of attributes they believe signify a well run and fundamentally strong business. S&P and MSCI both use ROE and leverage as signals of profitability and soundness, then add accounting accruals (a balance sheet and cash flow measure) or earnings stability to round out their ratings.
S&P MSCI
Return on Equity Return on Equity
Debt/Equity Debt/Equity
Accruals Earnings Stability
We examined the previously mentioned Technology companies that carry larger weights in the S&P Quality Index to determine which Quality attributes accounted for their presence in the index. The overwhelming driver of High-Quality Tech companies was ROE, for which all but one company ranked in the top quintile. This group of dominating Technology powerhouses has an average ROE of 42.7%, making them A-list candidates for any factor that includes ROE in its metrics. Leverage rankings are mixed, as mature Tech companies like Apple and Microsoft have added debt over the last several years. Accruals were also mixed but, given their lower levels of asset intensity, we noticed a tendency for intellectual-property Tech companies to rank high on this metric. Based on the importance of ROE to the overall Quality score, we suspect the Tech sector will continue to garner a large weight in the index as long as the earning power of its Social/Mobile/Cloud cohort remains strong.
Research Takeaways
- Quality, Volatility, and Dividend Growth have proven to be defensive options over the years, participating less in up markets but providing stability and a degree of safety in down markets.
- However, Quality failed to provide a safety net in the 4Q2018 selloff and, even worse, showed a very high correlation with Momentum… the quarter’s worst-performing smart beta factor.
- The Technology sector provides the common link between factors, as the golden age of Social/Mobile/Cloud generated tremendous momentum in those companies’ stock prices, along with extraordinarily high ROEs which landed them among High Quality’s elite class.
- For Quality to once again become a defensive diversifier to Momentum, we will likely need to see a material change in the Technology weighting in one of these indexes.
- Previous Leuthold Group factor research revealed that outperformance of the Quality factor often comes not from owning the highest Quality but rather from avoiding the lowest Quality companies. Portfolio managers acting at the stock level may be well served to heed this advice as they build defensive portfolios using the Quality factor.