
Company X is a multi-billion dollar market-cap company that has operations in over forty countries, revenues that reach over fifty billion dollars per year, and over 100 billion dollars in assets. When compared to Company Y, which is a mere multi-million dollar market-cap company that has small operations (perhaps in the state of New Jersey!), millions in revenue per year, and only a few million dollars of assets, Company X may at first look like the better investment to include in your portfolio. However, let’s level the playing field and consider quality, not quantity. This is how the quality factor works. It uses ratios to compare companies on a size-adjusted basis so that it can better evaluate the financial picture of each company in the context of critical questions such as: Which company is more profitable? Which company has less debt relative to the size of its cash flow stream? Which company is more efficiently generating sales from its assets over time? These questions change the way in which we compare Company X and Company Y. Table 2 shows the ROA, CTO, and leverage for Company X and Company Y, and for simplicity does not include ACCR.
![]() Table 2:
Table 2:
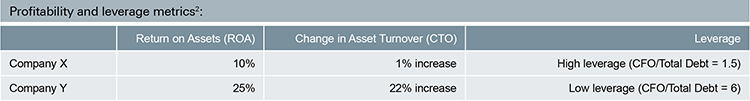
2.) We ignore accruals in this example to avoid complexity, and ROA (Return on Assets) = (Net Incomet / Average Total Assets), CTO (Change in Asset Turnover) = Salest/Total Assetst – Salest-1/Total Assetst-1, and Leverage = Operating Cash Flow / Total Debt. For illustrative purposes only. Data shown Is purely hypothetical and does not represent any particular product or security.
Here, we gain an entirely different perspective on Company X and Company Y. After adjusting for size, it seems that Company Y is vastly superior to Company X from a quality standpoint. Company Y is more profitable, more efficient, and has lower leverage than Company X. With an ROA of 25%, Company Y earns two-and-a-half times more dollars of earnings per dollar of assets than Company X, which has an ROA of only 10%. Furthermore, with a 22% year-over-year increase in asset turnover, it seems that Company Y was able to more drastically improve its efficiency when compared to Company X, which only saw a 1% increase in asset turnover. In other words, Company Y is finding ways to increase the dollar amount of sales it generates per dollar of assets at a faster rate than Company X—a positive signal for Company Y’s future profitability. Lastly, relative to Company X, Company Y has a far lower level of leverage (and therefore potentially lower level of risk). Company X’s annual cash flow from operations is only 1.5 times the amount of debt that it carries, while Company Y’s cash flow from operations is 6 times the amount of debt that it carries. In other words, Company Y would generate enough cash flow from operations to pay off all of its debt in only two months of normal business activity, while it would take Company X four times longer, or eight months to do so.
Which company would you pick? The quality factor overweights Company Y, and this is precisely why we believe that it is important for smart-beta strategies to have exposure to this factor and why we include it in our multi-factor ETFs. We hope that through these examples we have given you a better understanding of the quality factor and that it will help you make more informed decisions when considering factor investing. More on factor investing can be found on our dedicated factor investing website.
If you would like to receive future Xtrackers blog posts please subscribe.