
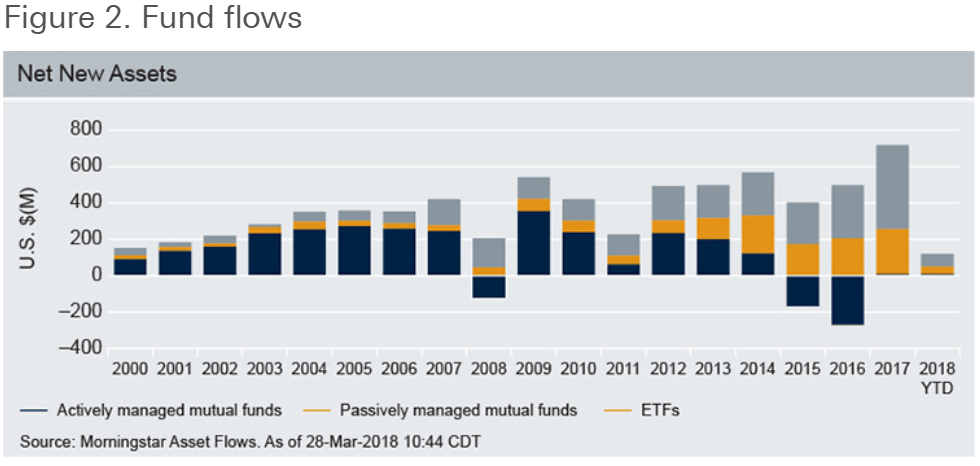
Passive flows, both MF and ETF, were dwarfed by active flows until 2008 when active and passive tussled for flow dominance for a couple years until passive firmly took control from 2011 (Figure 2). After 2014, the figures look very bleak for active indeed with net outflows in ’15 and ’16 and negligible inflows in ’17 and so far this year. Does this mean the end for active? Of course not, keep reading.
Critics of passive investing can debate the topic, and there are many facets to the discussion, but it’s key to note that this is an investment approach discussion, not an ETF one. More on this another time.
The second trend is ETFs themselves; the wrapper. ETFs that hold physically replicated portfolios are just a vehicle for strategies: equity, fixed income, and alternatives, with a passive or active approach. While most ETFs are passive and have benefitted from that trend, investors have also flocked to ETFs since the financial crisis for structural reasons. This is especially true for fixed income. The ETF offers intraday liquidity*, a generally diversified portfolio, generally low management fees, full transparency and are exchange cleared – counterparty risk to over-the-counter bond dealers was a very genuine risk during the crisis, as was liquidating cash bond portfolios.
![]()
Flow show
A further look at actual flows, show that ETFs have outstripped both active and passive mutual funds in recent years (Figure 2). To bring back my point that ETFs have not been a flow revolution, but an adoption of new technology in the same existing markets, consider this: there was a strong and stable growth trend in total flows from 2000 to 2007, from $153bn to $423bn per year, a change of 276% with relatively low volatility of flows. Post crisis, flows in 2009 were $543bn and $720bn in 2017, a change of just 33%, however with increased volatility. It’s clear from a glance at the chart that the second period saw far more variability to annual total flows. The real story is how the composition has changed. Market performance on the other hand is what has, in our opinion, propelled total fund assets.
The Takeaway
Passive and ETFs have grown tremendously. But mutual funds, active in particular, are still the largest part of the market and passive mutual funds have continued to see robust growth. While we all know the basic tenants behind the increase in popularity of passive and ETFs, we have to view this in the context of the market environment we have been in. We have seen nine years of a bull market with increasingly low volatility (Volatility: What Happens to ETFs?).
We feel this is a perfect scenario for passive strategies as active managers have limited opportunity to outperform a steadily increasing benchmark. These challenges and the low cost associated with passive has attracted the lion‘s share of asset flows. If volatility returns it’s possible we see investors reverse some of these flows back towards active managers that perform, but the ETF wrapper is here to stay.