By Rob Bush, DWS
Great athletes are known for constant self-evaluation and relentless performance analysis. Whether they played well, or poorly, many want as much detail as possible about what worked, and what didn’t, and why. Similarly in finance, much can be learned by analyzing approaches that go off benchmark to figure out what decisions paid off, either as a way to fine tune future performance, or as a vehicle to better understand past performance.
To be sure, attribution can be a tricky business, and lots of methodologies have been created to analyze portfolio performance. In this blog, I plan to briefly discuss two popular methods and provide some thoughts around what they are telling us, and how useful that information might be.
The Attribution Table
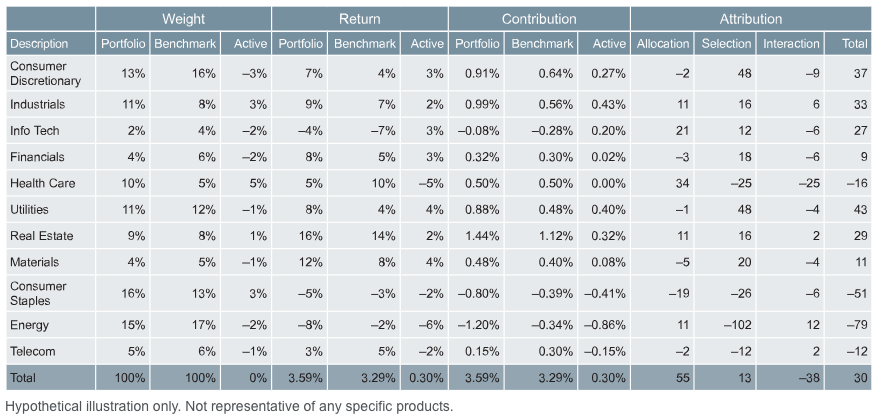
Figure One shows an attribution table with some made up numbers for a hypothetical portfolio that differs from the market in its stock and sector picks. Note a couple of obvious features. First, the portfolio and benchmark weights in each sector have to sum to 100% (in reality there could be a cash portion or other buckets but the intent here is to keep things simple). Second, the active weights (the differences in sector weights) have to sum to 0% – for every overweight there has to be an underweight.
Figure One: A hypothetical attribution table with example numbers
![]()