

Just like birds of a feather flock together, major central banks around the globe are again in sync when it comes to monetary policy. From the U.S. to Europe to Japan, they are largely in unison in acknowledging that global growth is weakening while trying to not panic investors who no longer have the luxury of just coasting along when constructing portfolios.
Earlier in March, the European Central Bank announced a fresh round of stimulus, and also pushed the timeline for providing guidance on the path of rates until December 2019. They also announced a program to provide inexpensive long-term loans for banks, similar to what they implemented in the past. In the United States, March’s FOMC meeting and press conference emphasized their dovish tilt with the dot-plot pushing further hikes out into the future as Chairman Powell noted that monetary policy is currently “in a good place”.
BREXIT, CHINA TRADE TALKS AND NEGATIVE BOND YIELDS
Of course, we would be remiss to not mention the continued Brexit drama, which now has a multitude of outcomes that investors must contemplate. What is increasingly becoming less of a binary event, the latest development involves Prime Minister May promising to resign should Parliament agree to her deal.
In addition, the U.S. – China trade talks remain ongoing with mixed messages on their progress from both sides. On the positive side, further duties from both parties have been ditched “until further notice”, as the Trump administration has officially shelved its threat to increase tariffs (from 10% to 25%) on $200 billion of Chinese exports. Although the markets have seemingly priced in some optimism around trade talks, the lack of clarity around pace of progress and the absence of a new deadline does, however, leave investors with a level of uncertainty.
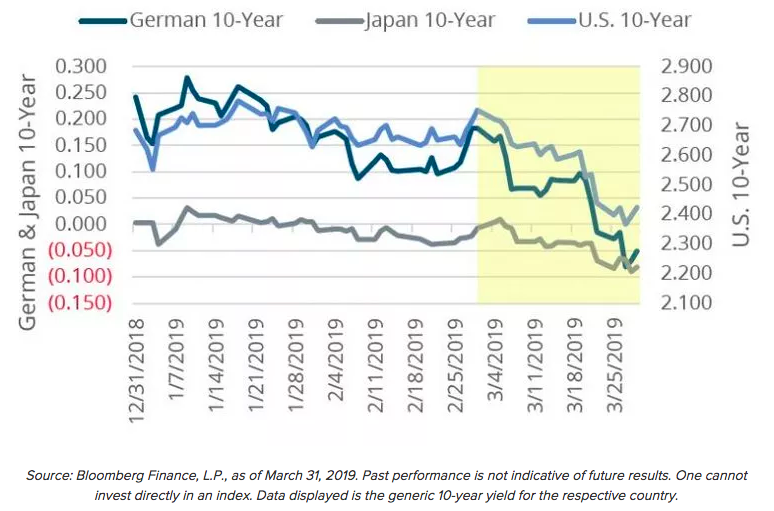
All of these headlines weighed on interest rates around the globe. The German 10-year Bund went into negative territory for the first time since 2016, the U.S. 10-year Treasury hit its lowest level since 2017, and the Japanese 10-Year Government Bond dipped further into negative territory, reaching its lowest levels since 2016.
Relative Value Themes
Concerns about growth prospects, as portrayed by the longer-term interest rate market, impacted cyclical sectors, value stocks, and small caps over the month of March, but the market has also taken into the account the balancing act that comes with lower rates, especially the Federal Funds Rate. With the dovish confirmation that occurred on March 20, the market-priced probability of a rate cut actually increased dramatically following the most recent FOMC meeting, and stands at almost 70% for a cut by the end of 2019. A lower Federal Funds Rate is traditionally accommodative, and positive, for risk assets, and domestic equity markets (as measured by the Russell 1000) saw their best first quarter return since 1998.
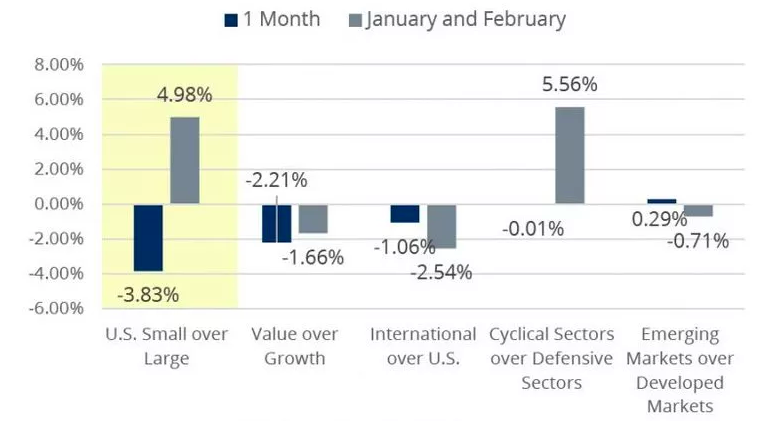
From a performance perspective, the momentum behind cyclical sectors and small cap stocks are clearly starting to slow, especially relative to their defensive sector and large cap counterparts. Through the first two months of the year, cyclical sectors outperformed defensive sectors by 5.56%. In March, defensives eked out a gain relative to cyclicals to the tune of 0.01%. Similarly, small caps outperformed large caps by 4.98% over January and February, but since March 1, this spread has narrowed, as large caps outperformed small caps by 3.83%.
Emerging markets, which was a winner relative to developed markets in January, are now laggards in the All-World ex-U.S. universe. Albeit just 29 basis points through March, the spread between the EM nations and the EAFE nations is one to continue watching, as it now stands at 40 basis points year-to-date, in favor of developed markets. Investors should keep an eye on the U.S. dollar and developments around trade as major macro drivers here.
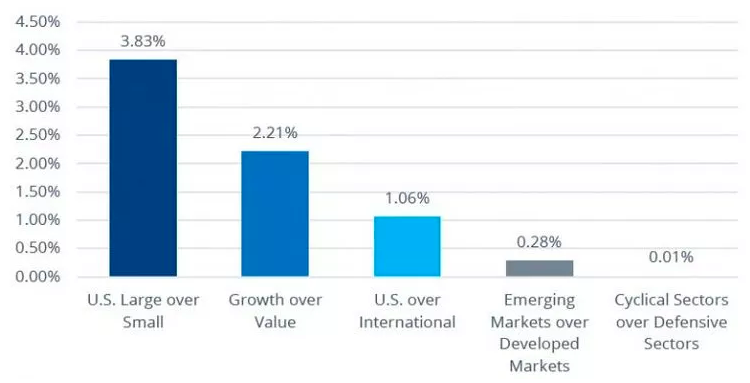
Along with the most recent trends favoring defensive sectors, growth stocks, and large caps, the trend towards favoring U.S. exposure relative to International exposure has continued to show merit. As questions surrounding global growth remain, the U.S. provided 1.06% in outperformance relative to their international counterparts, and the year-to-date spread widened to 3.74%.
Relative Weight Winners & Losers
In a stark reversal from January and February, U.S. small-over-large-caps strategy went from one of the top performing relative weight strategies to the worst, driven by negative performance in small caps. Domestic exposure continues to lead relative to International, as the spread widened for the third straight month. Growth shows promise, relative to value stocks, and that spread widened for the fourth straight month. While cyclical stocks compared to defensive stocks stalled as investors displayed a preference for lower volatility areas of the market.
FIGURE 3: SMALL CAP OVER LARGE WENT FROM ONE OF THE BEST TO THE WORST
Money In Motion
Unlike traditional ETF flow commentary that includes the entire set of ETFs in a given category regardless of how they are constructed, we focus on ETFs that specifically offer exposure to the intended underlying categories in order to more precisely identify trends. For example, our U.S. large cap category only focused on ETFs that seek to track broad-based U.S. large cap equities and excludes ETFs that may be exposed to U.S. large caps, but have other intended investment goals, such as a style or factor tilt.
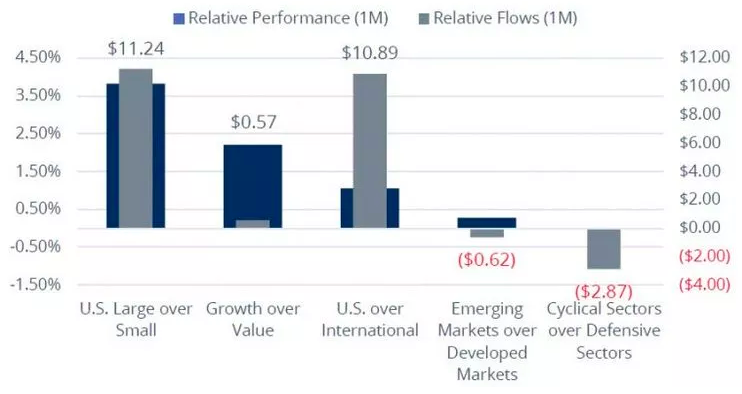
For the most part, ETF flows were aligned with performance trends over the month of March. The U.S. large cap and U.S. broad market categories have seen the largest absolute flows, with roughly $11.58B and $12.43B in net inflows, respectively. These two categories also saw the largest relative flows (relative to small caps and internationals, respectively) over the month of March, suggesting that investors have leaned towards higher quality names for risk asset exposure.
This “flight to quality” theme is confirmed when looking at the flows across cyclical stocks and defensive stocks, too. March paved the way for the largest net outflow (- $2.63B) across cyclical sector ETFs for 2019 thus far, while defensive sector ETFs saw the largest net monthly inflow (+ $0.23B) figure for the year. Not surprisingly, the bulk of those cyclical sector outflows came from the financials and technology sectors, which combined for $2.39B in net ETF outflows. For defensive sectors, every sector saw net inflows with the exception of consumer staples.
March also saw developed markets ETFs (+ $1.26B) take in more net monthly inflows relative to emerging markets ETFs (+ $0.64B) for the first time in four months. This was only the third such occurrence for flows between these two groups over the last 12 months. While the year-to-date flows still suggest positioning that favors emerging markets, investors should keep an eye on this, as other flow-related and performance results suggest that a shift may be occurring.
FIGURE 4 ETF FLOWS (IN $B) FOLLOWED PERFORMANCE LAST MONTH
WHERE ARE WE GOING?
YIELD CURVE INVERSION
While an inverted U.S. yield curve historically has served as a strong predictor of a U.S. recession, it tends to come with a relatively long lead time. Despite this, investors should keep in mind that the U.S. yield curve is but one of many indicators that may provide clues as to where the economy stands, and where it may be headed. For some, the overall level of the yield curve may matter more considering how low the level of rates are today compared to previous inversions. Looking ahead, the relative performance of value/growth, cyclicals/defensives, small caps/large caps have been largely one-sided over the last years as equity investors have been largely discounting a flattening or even inverted yield curve.
SLOWING GROWTH
A greater concern should be any continued weakness in economic growth, which would undoubtedly weigh on corporate earnings. However, China Manufacturing PMI surprised to the upside pointing to expansion, which may help near-term sentiment about the economic outlook even as PMIs in the Eurozone continue to point to contraction. Speaking of earnings, this upcoming first quarter earnings seasons will definitely dominate investor attention in the coming weeks. Beyond the fact that earnings releases and forward guidance will need to be the upside catalyst for stocks, investors should look for clues towards confidence regarding business growth (e.g. top-line expansion) and bottom line sustainability (e.g. late cycle margin pressures), as well as confidence surrounding macro-level concerns such as “global growth” or “trade.”
FOLLOW THE MONEY
In other words, this next earnings season may be the most important one yet. This seems to be said with every earnings season, but given that this season will provide investors with the first post-tax-relief numbers, and given the overall sentiment coming into this earnings season, all eyes will be on how well companies have been able to deliver on top and bottom lines. Earnings releases and forward guidance will need to be the upside catalyst for stocks for the near-term, especially since valuation multiples have re-rated across the board throughout the last quarter of 2018.
| Market | Earnings Per Share Growth (%) |
|---|---|
| U.S. Large Cap | 12.33 |
| U.S. Small Cap | 8.04 |
| Growth | 13.63 |
| Value | 11.68 |
| Cyclical Sectors | 11.45 |
| Defensive Sectors | 14.60 |
| U.S. | 12.33 |
| International | 6.15 |
| Market | Representative Index |
|---|---|
| U.S. Large Cap | Russell 1000 Index |
| U.S. Small Cap | Russell 2000 Index |
| U.S. Growth | Russell 1000 Growth Index |
| U.S. Value | Russell 1000 Value Index |
| U.S. Cyclical Sectors | MSCI USA Cyclical Sectors Index |
| U.S. Defensive Sectors | MSCI USA Defensive Sectors Index |
| U.S. | Russell 1000 Index |
| International | FTSE All-World ex US Index |
| Developed Markets | MSCI EAFE IMI |
| Emerging Markets | MSCI Emerging Markets IMI |
Definitions
Russell 1000: The Russell 1000 Index consists of the largest 1,000 companies in the Russell 3000 Index, which is made up of 3,000 of the largest U.S. companies.
Russell 2000: The Russell 2000 Index is comprised of the smallest 2000 companies in the Russell 3000 Index, representing approximately 8% of the Russell 3000 total market capitalization.
Russell 1000 Growth: The Russell 1000 Growth Index measures the performance of those Russell 1000 companies with higher price-to-book ratios and higher forecasted growth values.
Russell 1000 Value: The Russell 1000 Value Index measures the performance of those Russell 1000 companies with lower price-to-book ratios and lower forecasted growth values.
MSCI USA Cyclical Sectors: The MSCI USA Cyclical Sectors Index is based on MSCI USA Index, its parent index and captures large and mid-cap segments of the US market. The index is designed to reflect the performance of the opportunity set of global cyclical companies across various GICS® sectors. All constituent securities from Consumer Discretionary, Financials, Industrials, Information Technology and Materials are included in the Index.
MSCI USA Defensive Sectors: The MSCI USA Defensive Sectors Index is based on MSCI USA Index, its parent index and captures large and mid-cap segments of the US market. The index is designed to reflect the performance of the opportunity set of global defensive companies across various GICS® sectors. All constituent securities from Consumer Staples, Energy, Healthcare, Telecommunication Services and Utilities are included in the Index.
FTSE All-World ex US: The FTSE All-World Excluding United States Index is a free float market capitalization weighted index. FTSE All-World Indices include constituents of the Large and Mid-capitalization universe for Developed and Emerging Market segments.
MSCI EAFE IMI: The MSCI EAFE Investable Market Index (IMI), is an equity index which captures large, mid and small cap representation across Developed Markets countries around the world, excluding the US and Canada.
MSCI Emerging Markets IMI: The MSCI Emerging Markets Investable Market Index (IMI) captures large, mid and small cap representation across 24 Emerging Markets (EM) countries.
Direxion Relative Weight ETF Risks: Investing involves risk including possible loss of principal. The ETFs’ investments in derivatives may pose risks in addition to, and greater than, those associated with directly investing in or shorting securities or other investments. There is no guarantee that the returns on an ETF’s long or short positions will produce high, or even positive returns and the ETF could lose money if either or both of the ETF’s long and short positions produce negative returns. Please see the summary and full prospectuses for a more complete description of these and other risks of the ETFs.
An investor should carefully consider a Fund’s investment objective, risks, charges, and expenses before investing. A Fund’s prospectus and summary prospectus contain this and other information about the Direxion Shares. To obtain a Fund’s prospectus and summary prospectus call 646-569-9363 or click here. A Fund’s prospectus and summary prospectus should be read carefully before investing.
Distributor: Foreside Fund Services, LLC