

By Direxion
Once you move beyond plain vanilla passive indexes, ETF investing is about themes. Every ETF is built to reflect a particular slice of a market, allowing investors to participate in that theme in a cost-effective, liquid and transparent way. But investment themes run deep, and there’s only so much that one ETF can replicate
That’s why Direxion has introduced a new suite of 10 Relative Weight ETFs. These ETFs are designed to capture dynamic market themes by replicating a common investment strategy: relative value pairs.
Before addressing particular ETF themes, we’ll first dig into just what relative value pairs are and how Direxion Relative Weight ETFs work to replicate them.
Relative Value Pairs 101
In Wall Street vernacular, a pair trade is a strategy that is based on the concept of relative value—the value that one asset potentially has compared to another related one. Pair trades incorporate both long and short components from two highly correlated assets under the conviction that these assets are directly related to one another and will move in accordance to that relation. It’s important to note that although the industry term is pair trade, these positions may be held for periods of months, years, or longer, as long as there is a belief that the relative position is favorable; thus the term relative value investing.
Relative value positions typically involve a larger long position in an underperforming asset, while also adding a short position to a correlated asset. Often, the goal is to balance the exposure so that the overall position is neither extended beyond 100% nor net short, although the short position can also be used as a hedge against outsized loss in the long position.
Relative Value Investing Investing’s Simplest Form
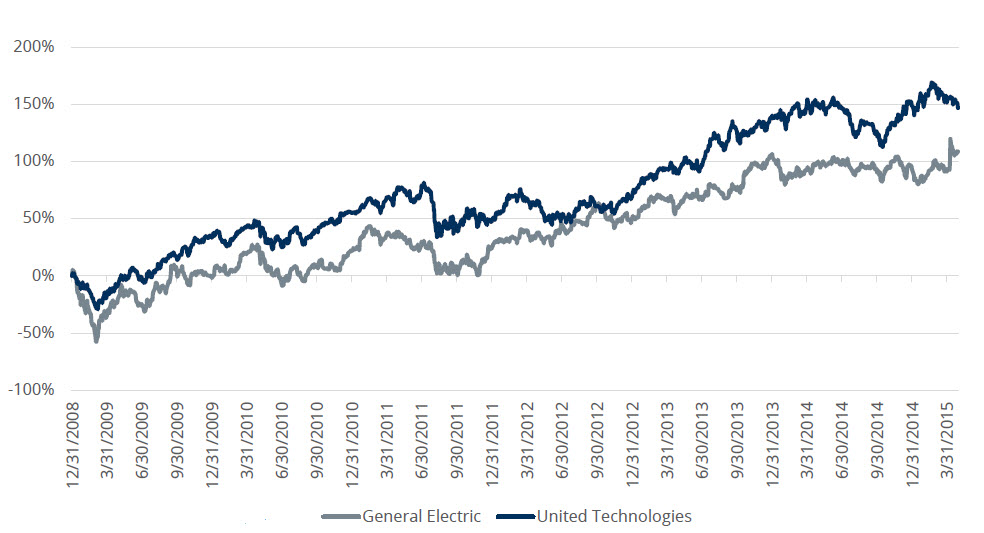
As a simple example, let’s use a relative value scenario of two individual industrial stocks. General Electric and United Technologies. Over the long term these stocks had been fruitful for patient, long-term investors. Yet, as you may already know, even two stocks that have a long history of moving in tandem, can have periods of diversion.
If you consider the extended period from early 2009 through early 2015, it’s clear that performance for these two names is highly correlated.
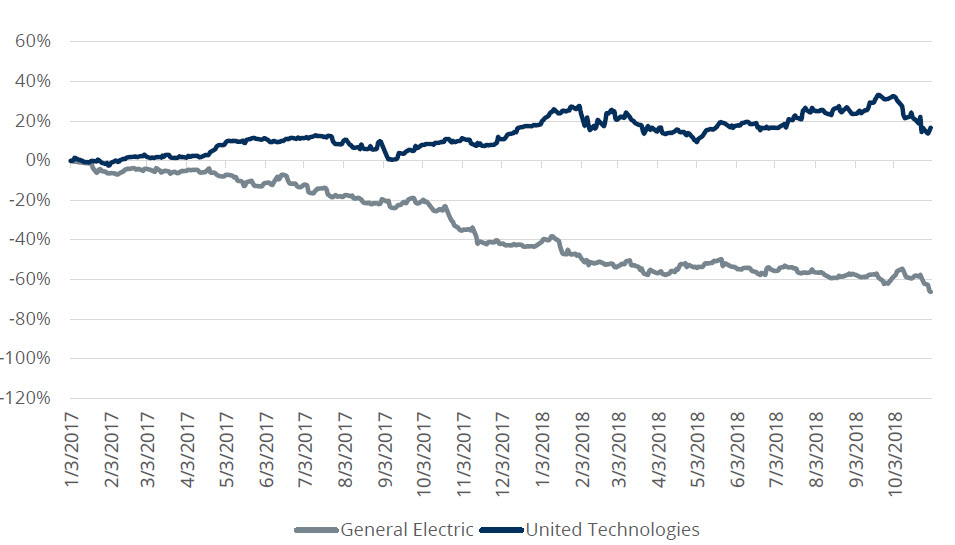
However, if you observed the period of January 2017 through early October of 2018, it’s clear that had you held a long position in United Technology, and sold GE short, you would have made out quite well. Of course you would have had to pay close attention to fundamental and regulatory matters for both names.
General Electric vs. United Technology, January 2017 through early October 2018
Relative Value Investing With Indexes
Most of us understand that picking individual stocks as winners and losers over a period of time is extremely difficult and time consuming for the average investor, even the average financial professional. However, understanding and choosing which broader categories of stocks will outperform others based on macro market views may be a simpler task, and one that we make all the time, in terms of asset allocation.
Typically, these can be in two binary areas of the market, like growth stocks (strong performance history but high valuation) and value stocks (low valuation but weaker historical performance), or two markets that tend to perform inverse to one another under certain market conditions, for example how emerging markets tend to do better as the U.S. dollar weakens, while the inverse is true for U.S. companies. In fact, investors continually consider which group of securities may be poised to move higher or lower, based on any number of economic or capital markets forces.
The Key To maximizing Your Point of View
Once you’ve made a hypothesis, for example, that value stocks will outperform over a certain period, now what? Most investors will do something like this:
Investment Approach A
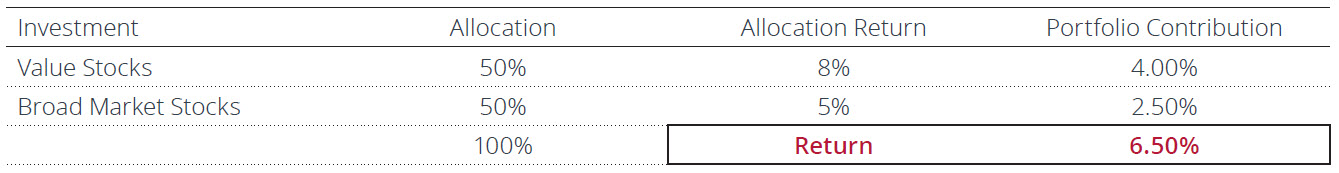
Let’s say they allocate an overweight amount of their U.S. stock allocation to value, in a 50% weighting, and the other 50% goes to broad market stocks. Why? Because for a hypothesis in which value stocks will outperform, it’s implicit that growth stocks will underperform, since value and growth roughly equal the constituency of the broad market. Let’s assume that they were right and value stocks returned 8 percent, growth stocks (the reciprocal of value stock) returned 2 percent and the broad market returned 5 percent. In this scenario, the investor would have a hypothetical return of 6.5%, and would have outperformed the market.
Assume the following view: “Value will ‘outperform’ over the next period”
Assume the following returns over period:
- Value stocks (e.g. Russell 1000 Value Index): +8%
- Broad US stocks (e.g. Russell 1000 Index): +5%
- Growth stocks (e.g. Russell 1000 Growth Index): +2%
But the reality is that value outperformed growth by 6 percentage points. Therein lies the opportunity. Because most investors are constrained to long-only execution of their macro views, and either by firm policy or lack of resources to access the short side, many are missing out on what could be an additional return stream.
What if that long-only constraint were overcome? What if you could overweight value and short growth stocks? Remember that the hypothesis of value stock outperformance must assume growth stock underperformance. That scenario may look something like this:
Investment Approach B
In this case the same portfolio could have three positions. The first position would be 75% value stocks. With a short position in growth stocks of -25% and a 50% weighting to broad market stocks. The net total allocation would still be 100%. Assuming again that hypothesis was right and value stocks returned the same 8 percent, growth stocks (the reciprocal of value stock) returned 2 percent and the broad market returned 5 percent, the overall portfolio return is now 8 percent.
Assume the following view: “Value will ‘outperform’ over the next period”
Assume the following returns over period:
- Value stocks (e.g. Russell 1000 Value Index): +8%
- Broad US stocks (e.g. Russell 1000 Index): +5%
- Growth stocks (e.g. Russell 1000 Growth Index): +2%
- Value return less growth return: +6%

Because the pair of positions has exposure to both sides of the relationship, its net profit comes from, and here’s the critical part, the spread between the long position and short position. When these relationships play out as an investor expects, the relative value position delivers its maximum profit potential, compared to a just a simple overweight position on the long side.
The math is simple, so why don’t investors take advantage of the short side of relative value executions of their macro investment points of view? The reasons are also simple. The challenge to implementing this type of allocation is that most investors can’t easily access the short side of what is implicit in their point of view. They’re constrained by their firm’s operations policy or platform capabilities or they lack familiarity with the mechanics of shorting. Shorting can also be expensive for those who can’t access the right resources.
Relative Value Strategies Using Relative Weight ETFs
For investors constrained to long-only investment parameters – by practicality or by policy – Direxion Relative Weight ETFs potentially deliver access to greater return:
- from both long and short return streams;
- without the need for additional capital, in a cost-effective, transparent, liquid structure within a 100% net exposure structure; and
- without the need for a margin account.
Investors can apply these products to their existing asset allocation strategies to seek to potentially profit during a variety of market conditions.
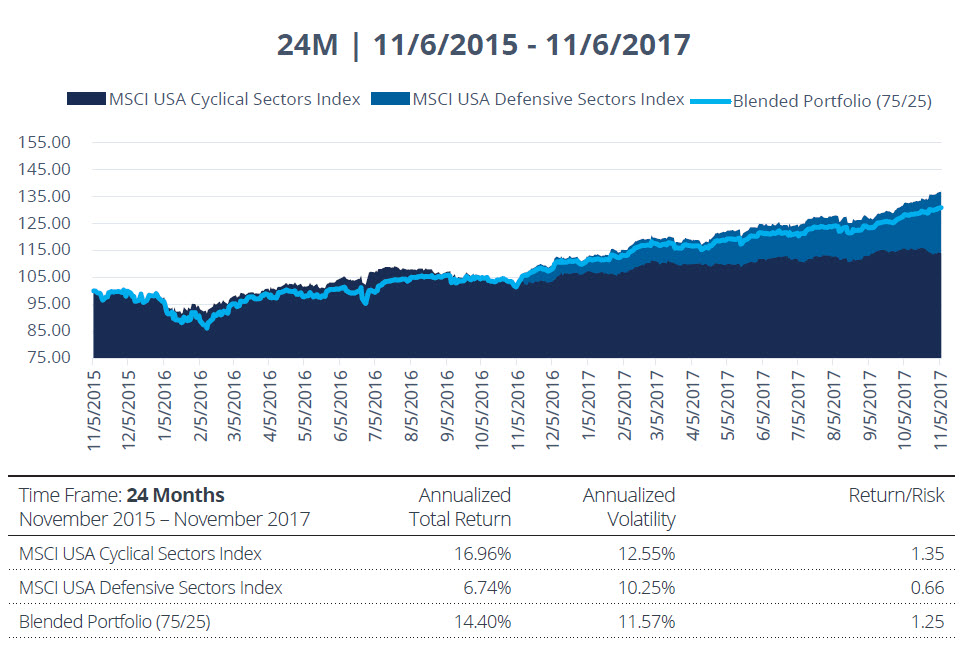
Take the Direxion MSCI Cyclicals Over Defensives ETF (RWCD) as an example, which includes long exposure to stocks from companies that rely on a confident consumer, like banks or technology companies, and short exposure to stocks from companies that supply necessary goods and services. In the case of RWCD, it will tend to perform better during strong economic conditions when consumers are spending money on expensive cyclic items, making defensives stocks less appealing to the overall market.
Below are three scenarios in which we compare long-only indexes & blended portfolio returns through different market periods.

During this period, the Financial Crisis recovery was a boon for cyclicals, as expectations for forward progress was supportive for sectors such as consumer discretionary, information technology and materials. Economic readings such as consumer sentiment, retail sales, and durable goods orders were quick to recover on their monthly readings, and cyclical stocks reacted quickly to the upside.
The breakout for cyclicals occurred closer to November 2017, as the global growth was extremely supportive for economically sensitive domestic names, especially during the lower volatility environment of 2017. Information technology led the way, as the U.S. technology giants posted impressive returns. Financials, industrials and materials were also movers for the notable spread between cyclicals and defensives.

The cyclicals versus defensives spread continued well into 2018, as the volatility spike in February of 2018 showed very little difference in drawdown between cyclicals and defensives. As the S&P 500 tried to re-establish new highs, information technology and financials were once again market leaders. Akin to the growth versus value story, the pro-growth cyclical sectors were major drivers of upside performance versus the defensive basket.
Long-Only Constraints: The Challenge To Implementing Macro Investment Views
As you can see from these examples, clearly there’s opportunity in implementing relative value investment views. Making the most of these opportunities is possible if you’re an investor that is able to easily access the short side of the equation.
Unfortunately, for the reasons stated previously, the majority of investors are long-only constrained. As such, most investors who execute macro views are limited to long side only, with inferior capital efficiency. Until now.
Fortunately, each of Direxion’s relative weight ETFs tracks a custom index that is meant to replicate a portfolio structured along the lines of a particular relative value point of view. The two components that comprise the overall “net spread” index are apportioned 150 percent long to 50 percent short.
Each ETF is built to perform at a ratio of 1.5 times that of the component it tracks on the long side while simultaneously returning -0.5 times the performance of the short component.
This means that the fund can seek to realize additional return from the favored asset class, while maximizing returns from the performance spread between both asset classes to try to take advantage of the differences in their returns.
This structure is intended emphasize upside potential while still incorporating the point of view that there’s a likelihood of a downturn in a correlated industry or market.
Another important aspect to note is that, unlike Direxion’s Daily ETFs, the suite of Relative Weight ETFs have net 100% total market exposure, and so do not have compounding risk from daily rebalancing. The Relative Weight ETFs are rebalanced on a monthly basis to accurately reflect each ETFs stated objective. This means that, at the end of each month, each ETF’s holdings are adjusted to fit the150 percent long/50 percent short exposure ratio.
| Ticker | Fund Name | Index |
|---|---|---|
| (RWIU) | Direxion FTSE Russell International Over US ETF | FTSE All-World ex US/Russell 1000 150/50 Net Spread Index (AWXUR1NC) |
| (RWUI) | Direxion FTSE Russell US Over International ETF | Russell 1000/FTSE All-World ex US 150/50 Net Spread Index (R1AWXUNC) |
| (RWCD) | Direxion MSCI Cyclicals Over Defensives ETF | MSCI USA Cyclical Sectors – USA Defensive Sectors 150/50 Return Spread Index (DU722431) |
| (RWDC) | Direxion MSCI Defensives Over Cyclicals ETF | MSCI USA Defensive Sectors – USA Cyclical Sectors 150/50 Return Spread Index (DU722430) |
| (RWDE) | Direxion MSCI Developed Over Emerging Markets ETF | MSCI EAFE IMI – Emerging Markets IMI 150/50 Return Spread Index (DU722424) |
| (RWED) | Direxion MSCI Emerging Over Developed Markets ETF | MSCI Emerging Markets IMI – EAFE IMI 150/50 Return Spread Index (DU722425) |
| (RWGV) | Direxion Russell 1000® Growth Over Value ETF | Russell 1000® Growth/Value 150/50 Net Spread Index (R1GR1VNC) |
| (RWVG) | Direxion Russell 1000® Value Over Growth ETF | Russell 1000® Value/Growth 150/50 Net Spread Index (R1VR1GNC) |
| (RWLS) | Direxion Russell Large Over Small Cap ETF | Russell 1000®/Russell 2000® 150/50 Net Spread Index (R1R2NC) |
| (RWSL) | Direxion Russell Small Over Large Cap ETF | Russell 2000®/Russell 1000® 150/50 Net Spread Index (R2R1NC) |
Shares of the Direxion Shares are bought and sold at market price (not NAV) and are not individually redeemed from a Fund. Market Price returns are based upon the midpoint of the bid/ask spread at 4:00 pm EST (when NAV is normally calculated) and do not represent the returns you would receive if you traded shares at other times. Brokerage commissions will reduce returns. Fund returns assume that dividends and capital gains distributions have been reinvested in the Fund at NAV. Some performance results reflect expense reimbursements or recoupments and fee waivers in effect during certain periods shown. Absent these reimbursements or recoupments and fee waivers, results would have been less favorable.
Direxion Relative Weight ETFs Risks – Investing involves risk including possible loss of principal. The ETFs’ investments in derivatives may pose risks in addition to, and greater than, those associated with directly investing in or shorting securities or other investments. There is no guarantee that the returns on an ETF’s long or short positions will produce high, or even positive returns and the ETF could lose money if either or both of the ETF’s long and short positions produce negative returns. Please see the summary and full prospectuses for a more complete description of these and other risks of the ETFs.