

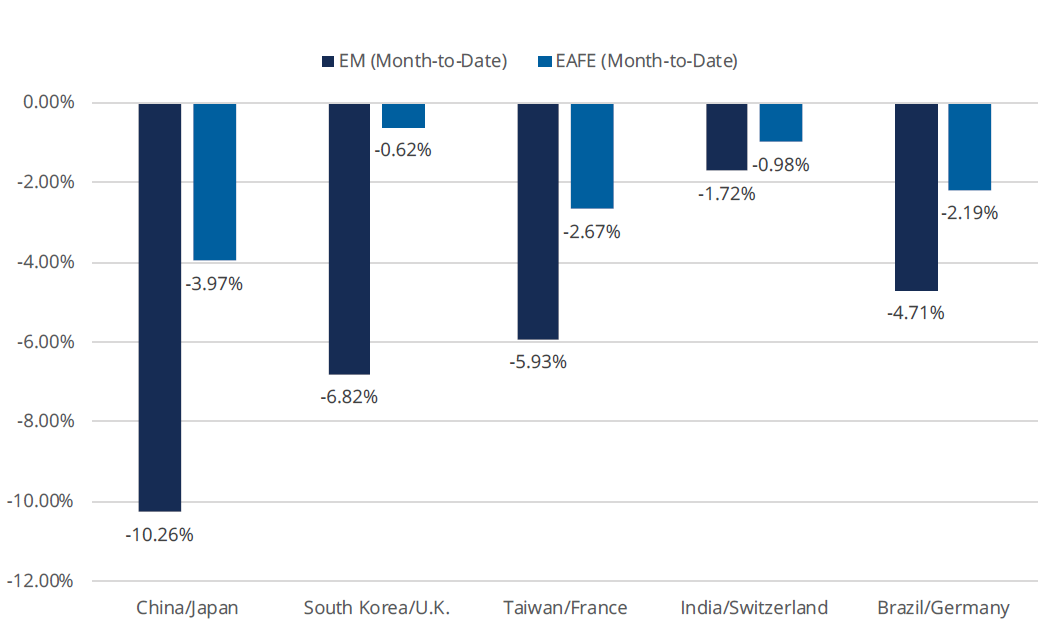
- On the back of a deteriorating macroeconomic backdrop, one that has been largely driven by trade and growth fears, emerging markets have been a stark underperformer relative to their developed market counterparts throughout the Month of May. In fact, not a single country in the top five emerging markets nations by weight has outperformed a developed market nation in the top five by weight. In both cases, the top five countries by weight make up over 67% of each respective basket.
- Unsurprisingly, China has been, by almost 3.50%, the worst performing single country across the top 20 nations in both emerging and developed markets throughout the month of May. While China remains at the heart of the ongoing trade dispute, some of China’s top trading partners (such as Hong Kong and South Korea) have suffered notable drawdowns as well, as the impact of a global growth slowdown continues to be priced into emerging markets, especially relative to more developed nations.
- Since Q4 2018, the performance spread between emerging markets and developed markets notably diverged coming into 2019, and once stood at 7.69% in favor of EM, as of February 8. Since then, the spread has been reduced to just 29 basis points in a matter of 70 trading days, barely in favor of EM. The velocity of this underperformance in emerging markets relative to the EAFE basket over the past 70 days personifies the market’s perception of the inherent risks over the short-term with EM risk assets.
Emerging Markets have Broadly Underperformed Developed Markets
Money in Motion
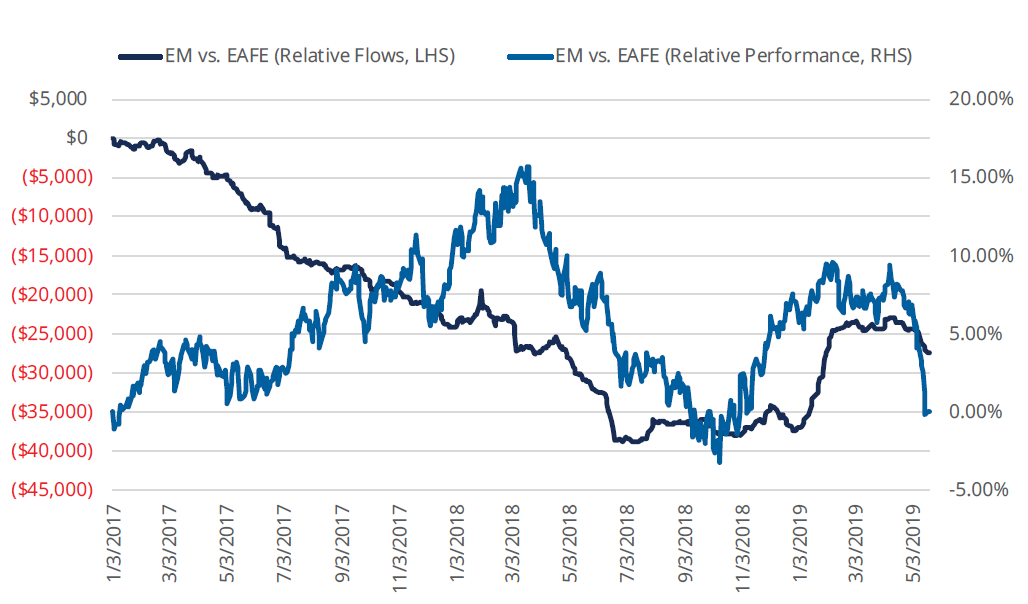
- Throughout the month of May, emerging markets ETFs (as covered by five EM ETFs with over $155B in assets under management) have seen $1.82B in outflows, while developed markets ETFs (as covered by six EAFE ETFs with over $218B in assets under management) have seen $1.11B in net creations. This $2.93B month-to-date spread makes up 78% of the relative strength in flows since March for the EM and EAFE pair. That is to say, the majority of the trailing ~ 3-month flow activity that favors EAFE has come in May.
- Despite this, the year-to-date story of positioning and relative strength in flows for EM ETFs is still intact, and a rather new one for EM risk assets. Since 2016, emerging markets ETFs have taken in $37.29B less in inflows relative to developed markets ETFs. Since the start of 2019, emerging markets ETFs have outpaced EAFE ETFs to the tune of $9.92B, which includes the most recent shortfall.
Year-to-Date Relative Strength in EM Flows Still Prevalent, but Short-term Flows in Favor of EAFE
What’s Next?
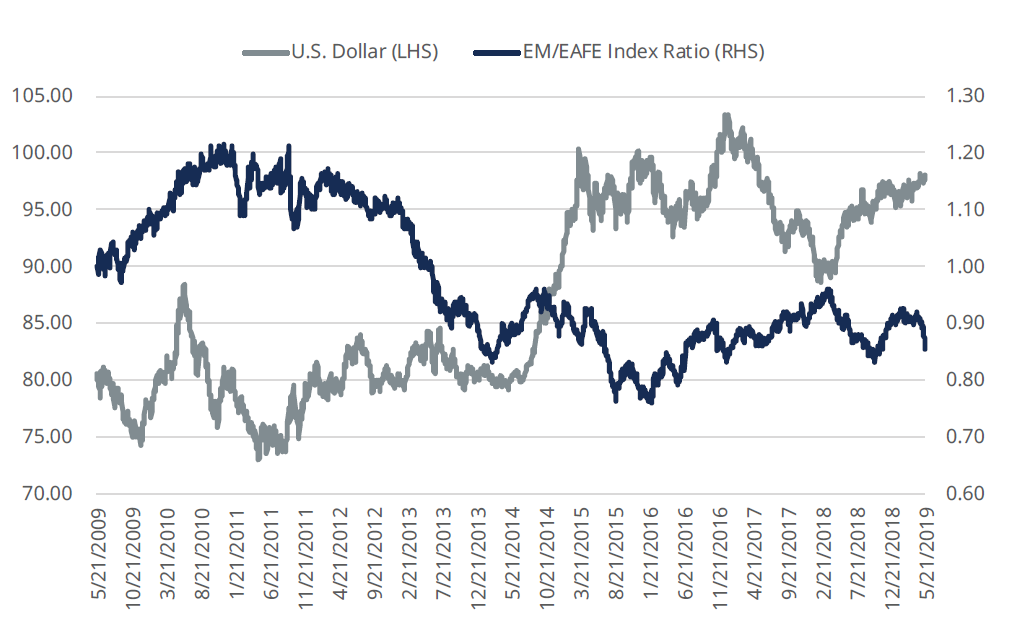
- We continue to watch the U.S. dollar and its impact on Emerging Markets, as its relationship to EM stocks is quite an important one. The U.S. dollar continues to act as a safe haven asset, especially amidst the ongoing U.S. – China trade dispute, Brexit, and global growth concerns. Since reaching a multi-year low in 2018, the U.S. dollar has only shown strength as it approaches a two-year high.
- The relationship between the U.S. dollar and the EM/EAFE index ratio is telling of a macro driver to which investors should pay close attention. Over the last 10 years, EM strength relative to developed markets has clearly been dependent on a weaker U.S. dollar. Beyond the fact that the U.S. dollar still commands a yield premium over a number of other global currencies, it has also been a reflection of a more cautious sentiment among investors, especially when it comes to global risk assets. This has seemingly put a cap on EM for the short term, and investors should look to both upcoming monetary policy as well as economic data for clues to the path of the U.S. dollar.
Dollar Strength has Curbed the Relative Strength Potential for Emerging Markets
Implementation Ideas
- For those who believe that fears of slowing global growth and rhetoric around the trade dispute are overdone, and recent flows and positioning is a reflection of the value that emerging markets represents, relative to developed markets, the Direxion MSCI Emerging over Developed Markets ETF [RWED] allows investors to gain excess exposure to emerging markets, relative to their developed markets counterparts.
- Another group of investors may believe that the U.S. Dollar is the significant driver for developed markets, relative to emerging markets. For those that may be expecting U.S. Dollar strength to continue, the Direxion MSCI Developed over Emerging Markets ETF [RWDE] allows investors to overweight Developed Markets at the expense of EM stocks.
Definitions
MSCI Emerging Markets IMI: The MSCI Emerging Markets Investable Market Index (IMI) captures large, mid and small cap representation across 24 Emerging Markets countries.
MSCI EAFE IMI: The MSCI EAFE Investable Market Index (IMI), is an equity index which captures large, mid and small cap representation across Developed Markets countries around the world, excluding the US and Canada.
DXY Index: The U.S. Dollar Index indicates the general international value of the USD. The U.S. Dollar Index does this by averaging the exchange rates between the USD and major world currencies.
Relative Weight ETF Risks: Investing involves risk including possible loss of principal. The Funds’ investments in derivatives may pose risks in addition to, and greater than, those associated with directly investing in or shorting securities or other investments. Investing in, and/or having exposure to, emerging markets instruments involves greater risks than more developed markets due to the potential for greater market volatility, lower trading volume, higher levels of inflation, political and economic instability, greater risk of market shutdown and more government limitations on foreign investments in emerging market countries than typically found in more developed markets. There is no guarantee that the returns on the Funds’ long or short positions will produce high, or even positive returns and a Fund could lose money if either or both of the Fund’s long and short positions produce negative returns. Please see the summary and full prospectuses for a more complete description of these and other risks of the Funds.
An investor should carefully consider a Fund’s investment objective, risks, charges, and expenses before investing. A Fund’s prospectus and summary prospectus contain this and other information about the Direxion Shares. To obtain a Fund’s prospectus and summary prospectus call 646-569-9363 or click here. A Fund’s prospectus and summary prospectus should be read carefully before investing.
Distributor: Foreside Fund Services, LLC