The major averages continued to tack on further gains in the 2nd quarter heading towards what could end up being the 10th consecutive annual gain for the S&P 500 (SPY).
Large-caps, however, haven’t been where the action is. In fact, the large-cap core and large-cap value groups have 2018’s worst performers struggling to stay above the breakeven mark. If 2017 was the year where you could make money almost anywhere, 2018 has been the year where investments in growth areas, such as tech, momentum and small-caps have paid off most.
![]()
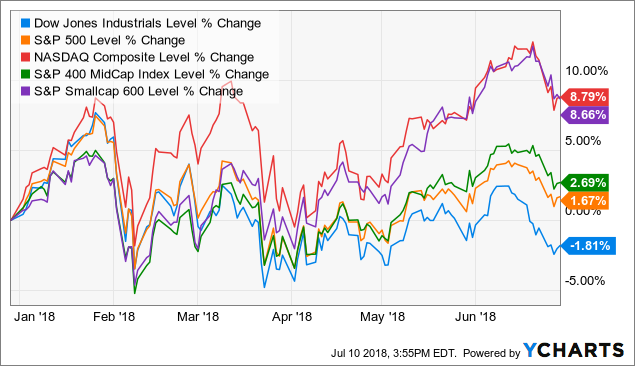
The tech-heavy Nasdaq (QQQ) continues to provide leadership for the market. It tacked on another 6% gain in the 2nd quarter pushing its return for the first half of the year almost 9%. Small-caps (SLY), however, were the quarter’s biggest winners. The S&P 600 also pushed its first half gain to nearly 9% on the heels of stronger earnings growth, less exposure to international turmoil and the benefits of corporate tax reform. The Dow (DIA) is back underwater on the year thanks in large part to the struggles in the consumer sector. Components, such as Procter & Gamble (PG), Walmart (WMT), 3M (MMM) and Johnson & Johnson (JNJ) were all down double digits in the first half.
Earnings
S&P 500 companies reported 25% year-over-year earnings growth marking the highest growth rate since Q3 2010. Revenue growth was roughly 8%. FactSet estimates are calling for 20% earnings growth for the full year 2018 with the biggest earnings and revenue gains coming from the energy, materials and tech sectors. 78% of S&P 500 companies beat their earnings estimates in Q1.
Thanks to last year’s Tax Cuts & Jobs Act, the trend of double digit year-over-year earnings growth is expected to continue through the next several quarters. If there’s any concern in these results, it’s that the majority of these gains are coming from tax savings and stock buybacks as opposed to organic growth.
The Economy
The economy has added an estimated 1.2 million jobs through the first half of 2018 and hasn’t posted a monthly loss of jobs since 2010. June’s report saw an uptick in the unemployment rate from 3.8% to 4.0%. While it may seem initially concerning that the rate climbed, it might actually be a good sign since, coupled with more than 200K jobs added, it could indicate that workers are coming off the sidelines and looking for employment again. The core inflation rate remains just a hair above the Fed’s target 2% rate and, for the time being, remains in check.
The big wild card right now could be the Fed’s path of interest rate hikes. A third rate hike before the end of the year seems like a foregone conclusion and the Fed Funds futures market is currently pricing in a 57% chance of a fourth hike in December. With the yield teetering perilously closing to becoming flat or even inverting, any further rate hikes at this point could push the economy into recession. Historically, every time the curve has inverted, it’s been followed by a recession about 18 months later. A 25 bp increase on the short end without a corresponding lift on the long end would put the yield curve nearly at the point of inversion.
Ryan Detrick on Twitter posted this nifty little infographic that helped show how the markets have responded to flat rate curves in the past.
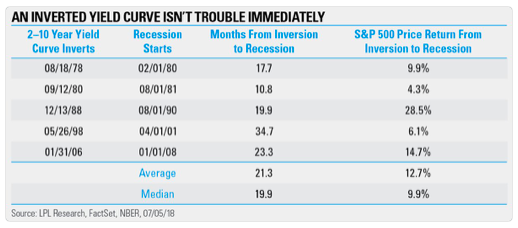
On average, the economy takes nearly two years on average to slip into recession following a curve inversion. Perhaps more interesting is the fact that the market still tends to post gains immediately following the inversion. In other words, no reason to immediately panic, but it should put you on alert for when it happens.
Washington’s Focus on Protectionism
Activity in Washington is almost entirely centered around tariffs and their impact to the global economy. Just this week, President Trump announced the intent to levy tariffs on another $200 billion worth of Chinese imports to go along with the $50 billion in total either already in effect or expected to go into effect soon. The news, of course, sent Chinese stocks downward with the U.S. indices following suit.
The big question now is when does it end. Rising tariffs will almost certainly have a negative impact on global growth, which makes coming to an agreement on when begin easing them that much more important. So far, it’s just been Chinese imports which have been affected, but imports from Mexico, Canada and Europe could soon be impacted as well. As I mentioned in an earlier post, trade wars raise the prices of goods for consumers and force to companies to reassess how and where they’re doing business (see Harley-Davidson (HOG) and their plan to move some operation out of the U.S.).
Trump appears to have no plans to ease tariffs any time soon and that could be bad news for the global economy.
Tech and Consumer Discretionary Lead; Utilities Stage Furious June Rally
Tech (XLK) and consumer discretionary (XLY), two segments of the economy that are most impacted by a strong economy and the corresponding growth in spending and consumption that come with it, have been 2018’s top performing sectors posting gains of 9% and 11%, respectively. June, however, was an interest rate story. As yields began pulling back, so did these two sectors, which opened the door for more rate-sensitive sectors, such as utilities (XLU) and real estate (XLRE) to rally. The Utilities Select Sector SPDR ETF, at one point in June, was up in 15 out of 16 trading days.
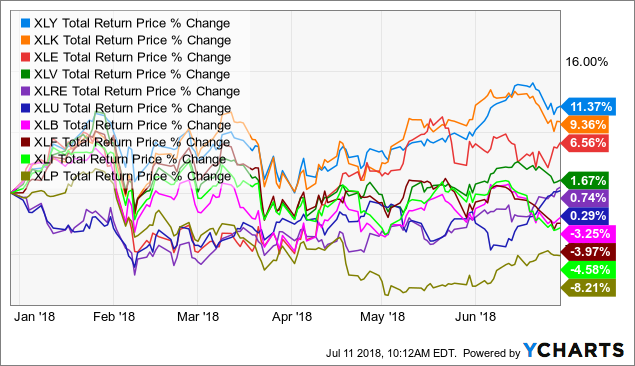
The financial sector (XLF) has to be the biggest disappointment of the year. Favored by many at the beginning of the year due to several anticipated rate hikes, it has been one of the market’s worst performing groups. The big banks begin reporting 2nd quarter earnings at the end of this week. I’m still optimistic for good results from these banks, but forward guidance could be weak leading to further declines.
The energy sector (XLE) has done well as expected, but the consumer staples sector (XLP) has me intrigued. It’s gotten left behind in 2018, but the group has rallied over the past several weeks along with utilities and real estate. Investors have begun returning to staples lately (XLP has had net inflows of nearly $700 million since June 1st) and could be viewed as a good landing spot for stock pickers if they feel that global growth is slowing or U.S.-China trade relations are worsening. XLP is up to a 2.8% yield, roughly the same level as 10-year Treasuries. Consumer staples performed well a few years ago when these two yields began converging.