

The S&P 500 Index made headlines earlier this week for entering a “death cross” technical pattern, and while the S&P 500 Equal Weight Index has yet to make the cross, cushioned by its increased exposure to the energy sector, now is an ideal time to add more exposure to your portfolio for a discount.
The S&P 500 Index hit the death cross on Monday for the first time since March 2020, following the tech-heavy Nasdaq Composite that entered a death cross last month and the blue-chip Dow Jones Industrial Average which saw the same pattern earlier this month.
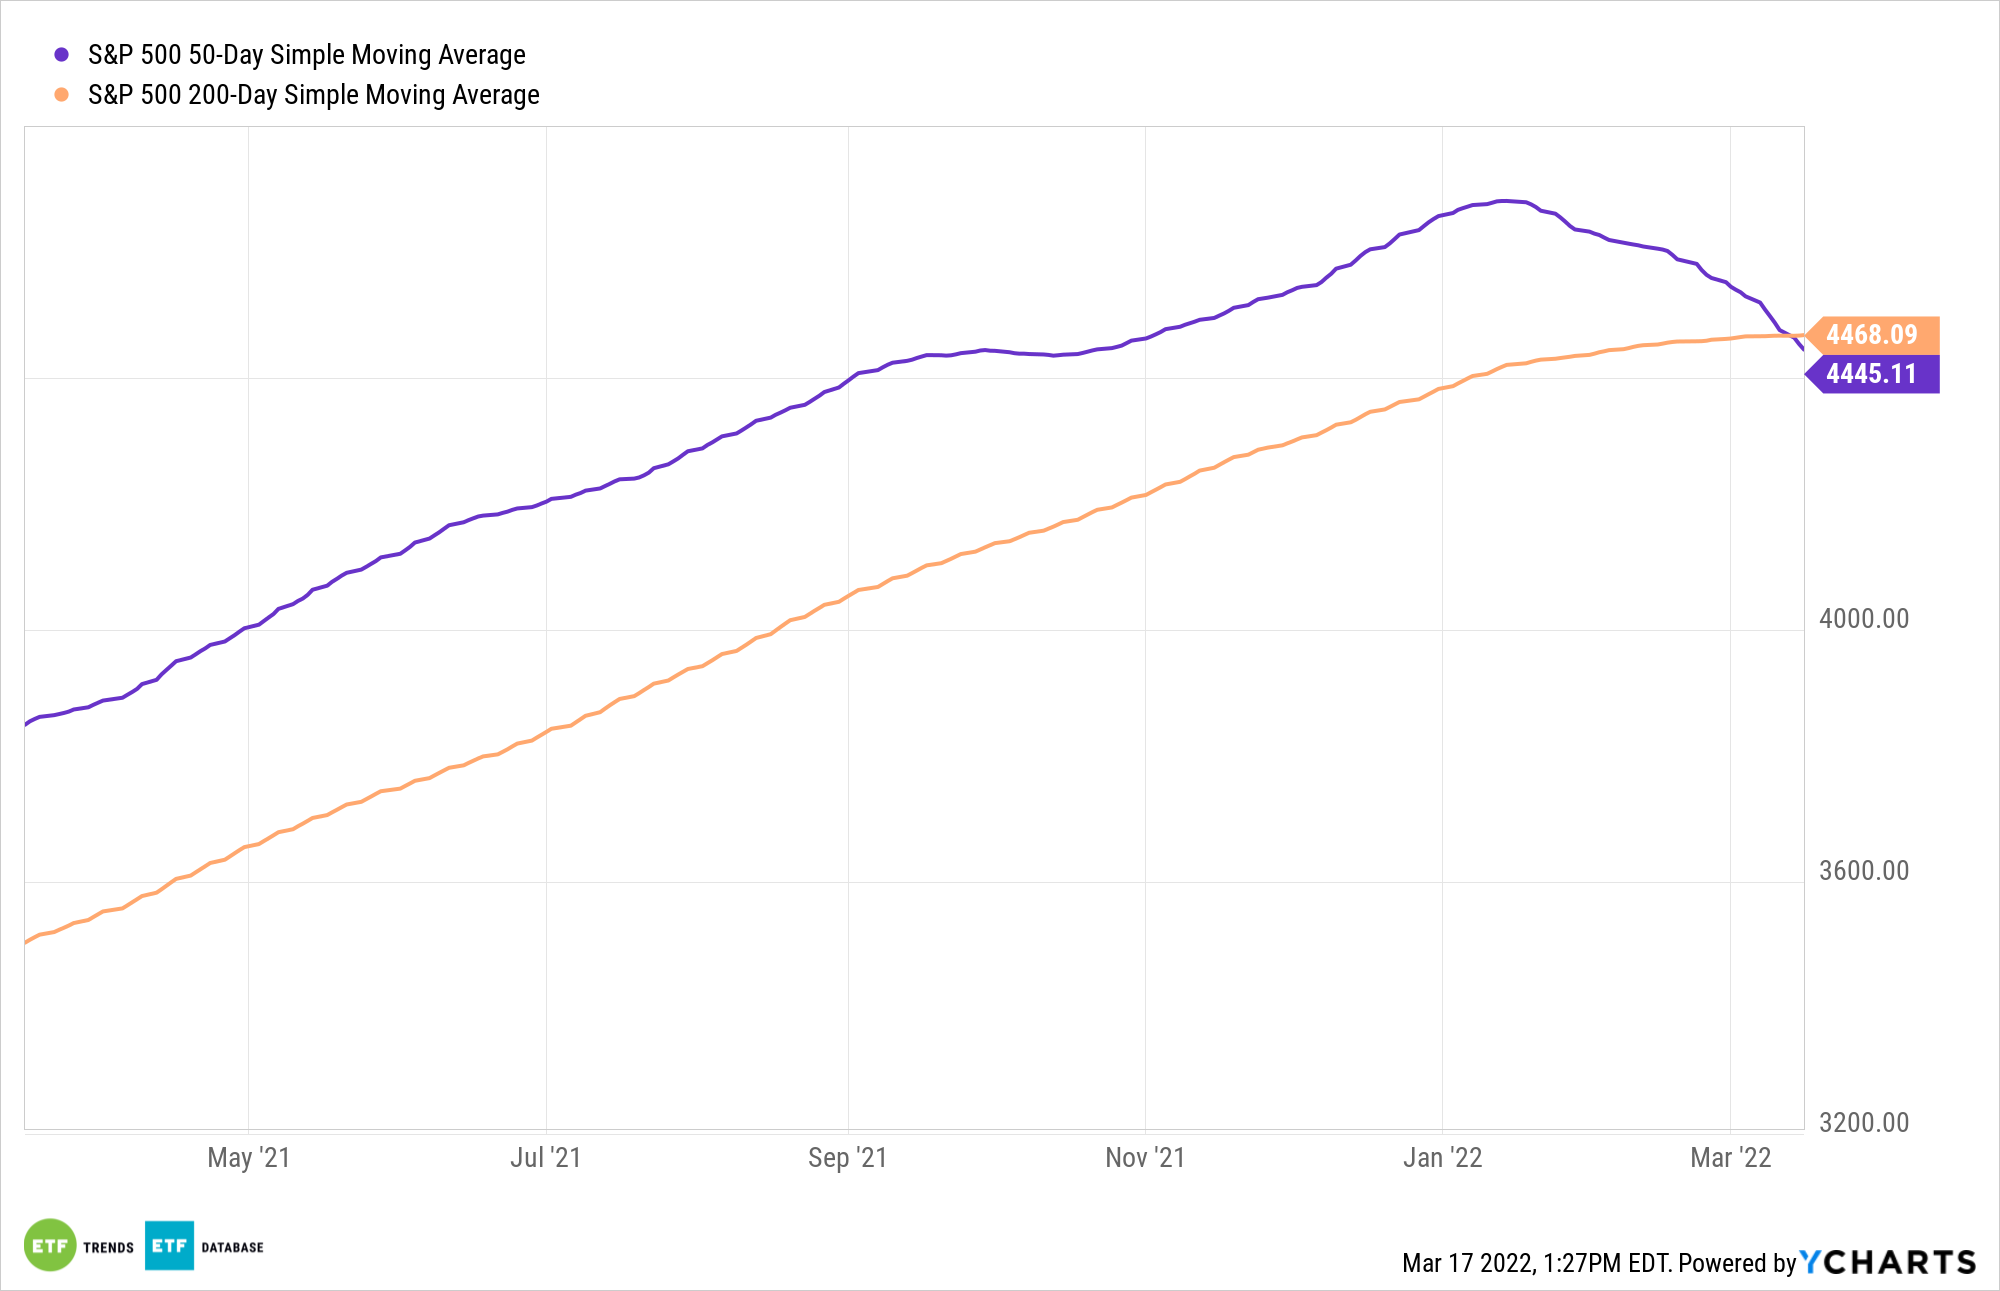
The death cross occurs when an index’s 50-day moving average crosses below its 200-day moving average. The simple moving average is an indicator of health for individual stocks and can be used to identify market trends and key price points. According to some investors, a healthy stock will consistently close above the 200-day moving average, according to YCharts.
However, in the current market environment, marred by turbulence, inflation, and uncertainty about rising rates and geopolitical tensions, longer-term investors have the opportunity to capitalize on traditionally expensive, highly-regarded funds trading at a significant discount to their historical moving averages.
“If you’re a long term investor, you’re naturally looking to allocate and you’re thinking longer term, and so really, when you see these kinds of corrections, as ugly and as uncomfortable as it is, this is really time to add exposure,” Nick Kalivas, head of core equity and factor ETF strategies at Invesco, said.
“It’s always most comfortable to add last year or in late ‘20 when it’s roaring, but it’s these corrections that are really providing an opportunity,” Kalivas added.
Historically, the death cross pattern has been a lagging indicator and shouldn’t be used as a signal for investors to panic. Looking back to the last occurrence in March 2020, the S&P entered a death cross on March 30, but it actually bottomed seven days earlier on March 23.
“Over the past decade, a death cross certainly hasn’t been ominous,” Willie Delwiche, investment strategist at technical-analysis service All Star Charts, told Bloomberg. “Most corrections since then have been short-lived, so by the time the two moving averages cross over each other, the damage is done. If the bottom isn’t in place, it’s getting close.”
According to S&P Dow Jones Indices, historical data show the equity markets may be more robust than we expect and tend to bounce back quickly after elevated volatility.
Looking at all the trading days on which VIX hit above 30 and calculating the S&P 500 returns in the subsequent six months and 12 months, the charts show that the vast majority of these 557 days were followed by a positive return in the next six months (82%) and 12 months (88%), according to S&P Dow Jones Indices.
“In the coming weeks, the swings in U.S. equities could continue and test investors’ sentiment. Big problems remain and big opportunities emerge. Fasten your seat belts and stay cool,” Berlinda Lio, director, global research & design, S&P Dow Jones Indices, wrote in an Indexology Blog update.
Investors looking to capitalize on the emerging opportunities should consider the Invesco S&P 500 Equal Weight ETF (RSP) and the Invesco ESG S&P 500 Equal Weight ETF (RSPE). Opting for an equal-weight index, as opposed to a market cap-weighted approach, can provide diversification benefits and reduce concentration risk by weighting each constituent company equally so that a small group of companies does not have an outsized impact on the index.
For more news, information, and strategy, visit our Portfolio Strategies Channel.