
By Andrew Neatt, Private Investment Advice, TD Wealth
In the factor world of investing, Low Volatility and Quality have been commonly referred to as defensive factors. The following is an examination of the performance of the S&P 500 Quality Index and the S&P 500 Low Volatility Index compared to the S&P 500 during the last 3 equity bear markets. The graphs and data in this report are generated from the Optimal Asset Management’s Factor Allocator Tool.
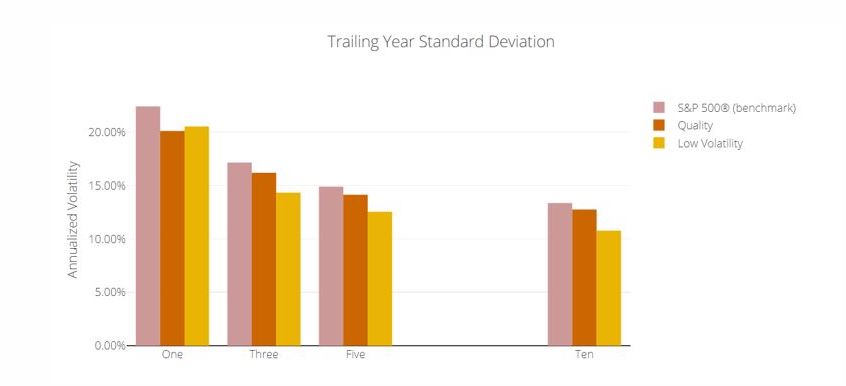
Before we examine this performance it is important to understand why Quality and Low Volatility have been considered defensive factors. There are multiple reasons why they have been considered defensive but here are three good reasons. First of all, they have historically exhibited less volatility as measured by standard deviation on a consistent basis. The graph below compares the annualized volatitity over the past 1, 3, 5, and 10 year periods ending July 31, 2020 of the S&P 500 Index, S&P 500 Quality Index, and S&P 500 Low Volatility Index.
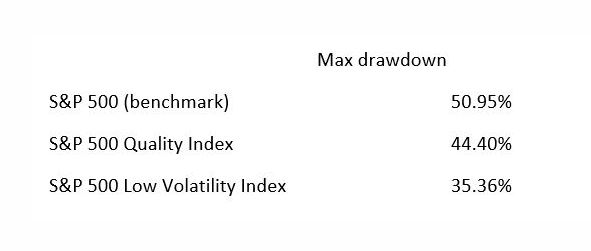
Another reason is that over the long term, the maximum drawdown of each of these indices has not matched the extent of the maximum drawdown experienced by the S&P 500 as shown in the table below (period examined is from January 3, 1995 to July 31, 2020):
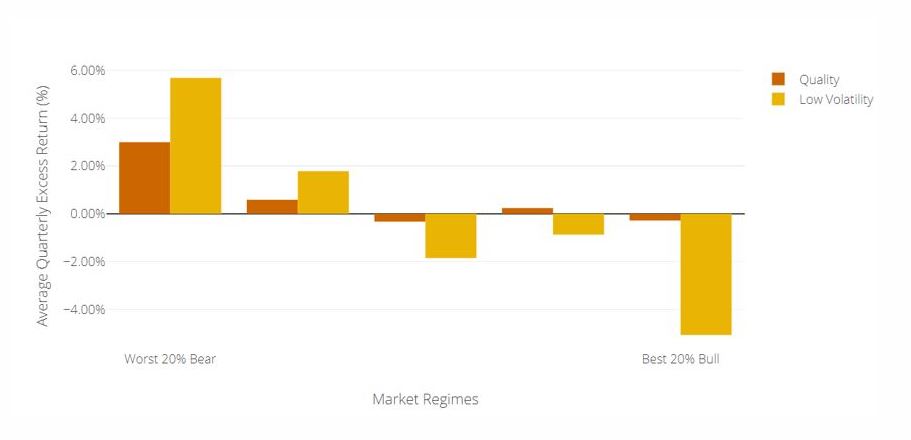
A third reason, on average the S&P 500 Quality Index and the S&P 500 Low Volatility Index have outperformed the S&P 500 during the worst equity market regimes. To support this point, the following graph shows the average quarterly excess returns of the S&P 500 Quality Index and S&P 500 Low Volatility Index compared to the S&P 500 Index over a variety of market regimes ranging from the worst bear markets to the best bull markets during the period of January 3, 1995 to July 31, 2020.
At the time of writing we are currently at or near all-time highs for the S&P 500 only a few months after the most recent equity bear market low so it is timely to compare the performance of these defensive factors during this year’s equity bear market to the previous two equity bear markets.
Each of the following three bear market comparisons examine the performance over an 18-month period that include similar time frames pre and post equity market low. For example, the 2002 analysis includes 88 days of recovery after the low of 2002, the 2009 analysis includes 116 days of recovery after the low of 2009, and the 2020 analysis includes 102 days of recovery after the most recent low.
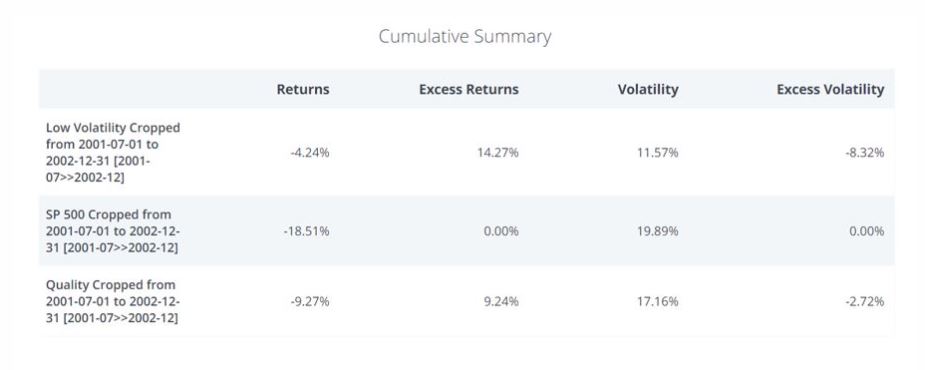
First, the following is a look at the equity bear market of 2002:
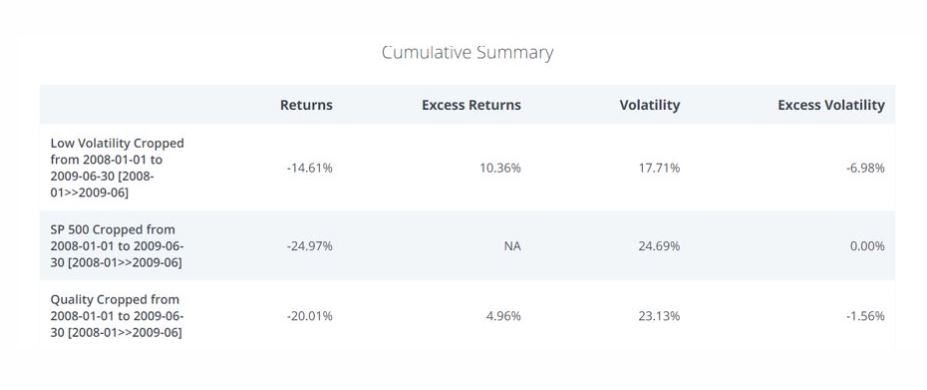
Next, a look at the 2009 equity bear market:
Finally, the most recent bear market:
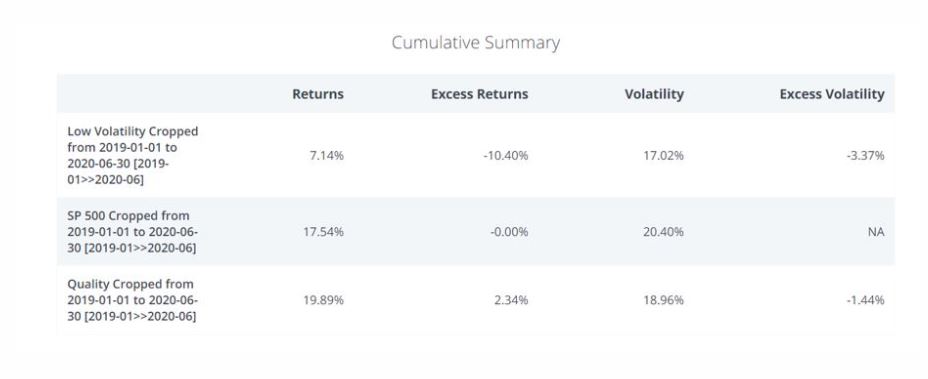
After examination of these three tables, one can see the consistent reduced volatility associated with the S&P 500 Quality Index and the S&P 500 Low Volatility Index compared to its parent benchmark, the S&P 500 in the past 3 bear markets. When it comes to returns, the S&P 500 Low Volatility Index and the S&P 500 Quality Index both outperformed in 2002 and 2009. However, in 2020, while the S&P 500 Quality Index outperformed the S&P 500 again, the S&P 500 Low Volatility Index underperformed.
The posts on this blog are opinions, not advice. Please read our Disclaimers.