

By Marc Odo, Swan Global Investments
It can be discouraging when an active manager’s short-term up capture isn’t on par with their long-term up capture. But this is a side effect of the measuring and using averages for risk/return metrics, returns, and the like. Averages naturally mask individual discrepancies and may produce misleading expectations. While averages are useful, it is important to remember their limitations.
How Averages Obscure Details
Let’s take a look at how averages can mask individual variations by looking at the S&P 500. Between 1971 and 2017, the S&P 500 averaged an annual return of 10.68%. Across those 47 years, there was only one year that had a return near the average 10.68% return: In 2004, the S&P 500 had a return of 10.88%. In fact, there were only three years out of those 47 where the S&P 500 was within +/- 2% of its long-term average. In that span, the highest return was +37.58% (1995) and the lowest was -37.00% (2008). Individual year returns fell far and wide between those two bookends.
An average return is just that—an average. Inevitably some numbers will be higher, and some will be lower. Even though the S&P 500 averaged a return of 10.68% between 1971 and 2017, that period experienced individual years that were extremely high, like in 1995, or extremely low, like in 2008. Someone expecting a 10.68% return during 2008 would have been very upset. But over time, the numbers average out.
While many people understand the idea that returns in an individual period will differ from their long-term average, it is important to remember that the concept of averages extends to most risk and return metrics as well. Measurements like up/down capture will fluctuate in the immediate short term as a measure in any one given period is likely to be higher or lower than its long-term average.
While in the short-term up/down capture can give you an idea about a manager’s monthly or quarterly performance, the measure is much more useful over longer periods of time.
Averages & Expectations
Extending the concept of averages, it would be a mistake to assume that a manager’s quarterly up/down capture will remain the same every quarter.
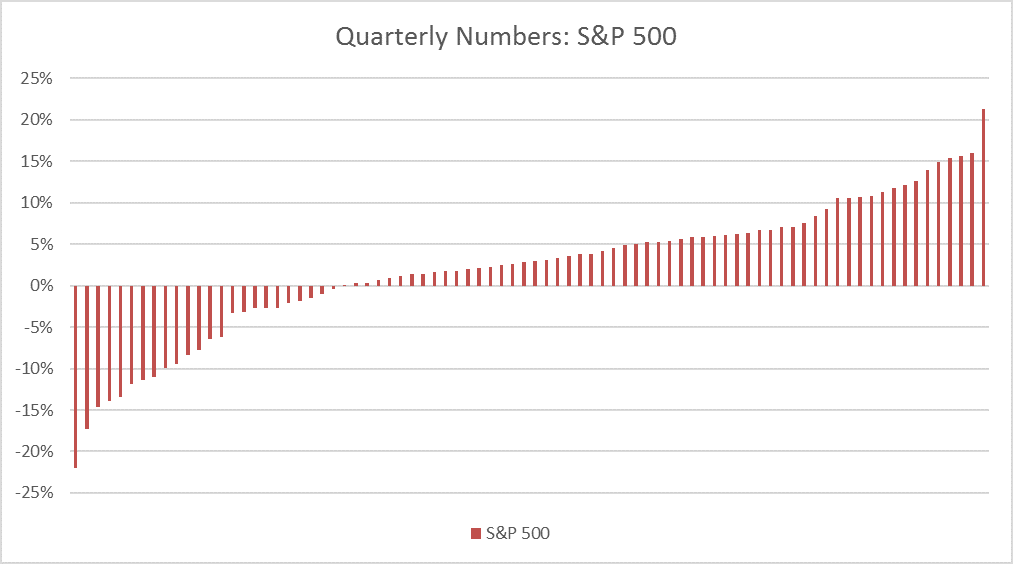
![]() For example, let’s look at the up/down capture of the Defined Risk Strategy (DRS). Between July 1997 and December 2017, the quarterly up capture of the DRS has been 52.5% and the quarterly down capture has been 13.0%. During the same span for the S&P 500, there have been 58 up quarters and 24 down quarters. Sorted from worst-to-best, the 82 quarterly returns of the S&P 500 since July 1997 look like this:
For example, let’s look at the up/down capture of the Defined Risk Strategy (DRS). Between July 1997 and December 2017, the quarterly up capture of the DRS has been 52.5% and the quarterly down capture has been 13.0%. During the same span for the S&P 500, there have been 58 up quarters and 24 down quarters. Sorted from worst-to-best, the 82 quarterly returns of the S&P 500 since July 1997 look like this:
Source: Zephyr StyleADVISOR, Swan Global Investments
If the DRS never deviated from its average capture ratios and always participated in 52.5% of every up quarter and 13.0% of every down quarter, the returns of the DRS would look like this:

Source: Zephyr StyleADVISOR, Swan Global Investments
While the consistency and predictability of the measurement look cleaner, the reality of the situation is much less tidy.
Averages aren’t a Guarantee & Deviations aren’t Always Bad
Just like any one year’s return tends to deviate far from its long-term average, so do the capture ratios in any one quarter. The chart below illustrates how the DRS’s actual quarterly returns compare to those of the S&P 500:

Source: Zephyr StyleADVISOR, Swan Global Investments
As the graph shows, individual discrepancies can happen often. Sometimes the DRS captures much more than 52.5% of an up quarter, sometimes much less. Sometimes the DRS captures more than 13.0% of a down quarter, sometimes less. Despite the discrepancies, the long-term up/down capture averages to 52.5% on the upside and 13.0% on the downside.