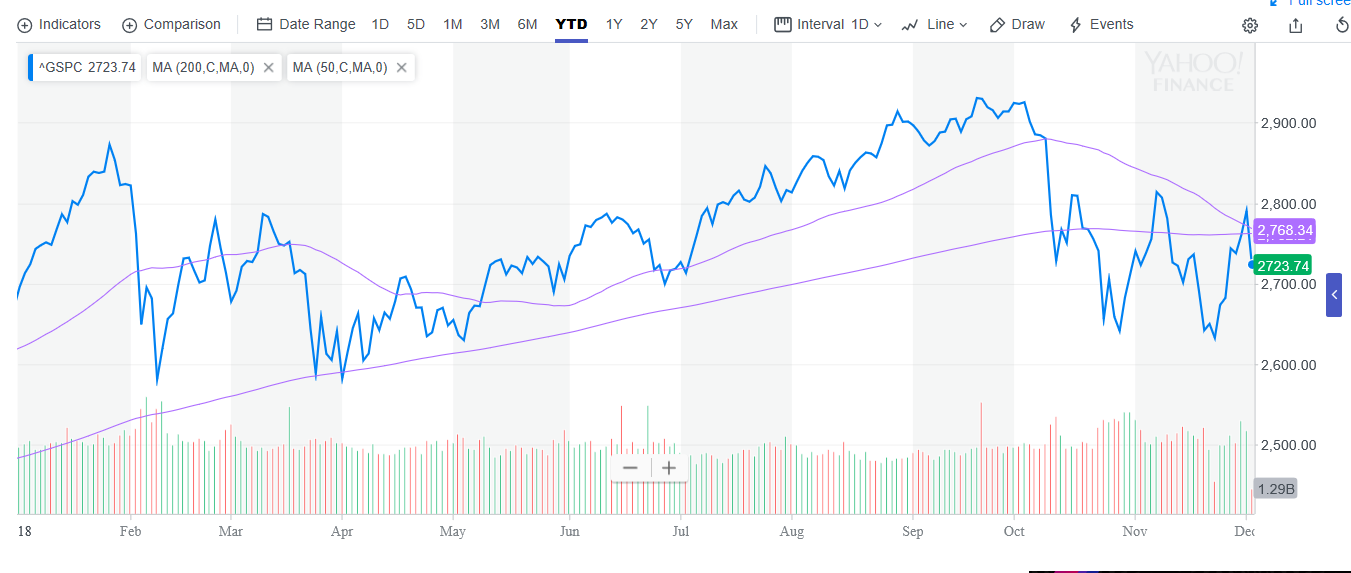
Trade war fears seeped back into the markets as investor optimism surrounding the tariff war ceasefire between U.S. President Donald Trump and Chinese president Xi Jinping faded, causing the S&P 500 to dip below its 200-day moving average while the “death cross,” a technical chart pattern term that could signal a major sell-off, looms.
The Dow Jones Industrial Average fell over 700 points on Tuesday while the S&P 500 followed its lead, declining over 2%. As the S&P 500 crossed below its 200-day moving average, the 50-day moving average was in its sight, signaling a possible “death cross”–when a short-term moving average falls below the long-term moving average–a forecast that more pain could be ahead for U.S. equities.
 Following October’s bout with volatility that spilled over into November following the mid-term elections, the “death cross” is certainly not a welcome sign for investors. However, others are quick to point out that the reliability of the signal is questionable and that it could also present an ideal buying opportunity.
“The problem is that death crosses are quite unreliable signals in the stock market,” said Michael Kahn, a Kiplinger contributor, in an article. “Sometimes they do forecast a major selloff ahead. But other times they actually mark good buy signals.”
“Historically, death crosses have signaled pending bear markets and continued to keep investors out of the market as prices fell. However, they have not been not so good with corrections,” Kahn added.