
TAB I – Shiller Barclays CAPE® U.S. Sector Index
DoubleLine Shiller Enhanced CAPE® Structure
- The distinct structure of the DoubleLine Shiller Enhanced CAPE® Strategy allows investors to simultaneously access returns of the equity markets and fixed income markets. By using an equity index swap, $1 invested in the strategy provides approximately $1 of exposure to each market.
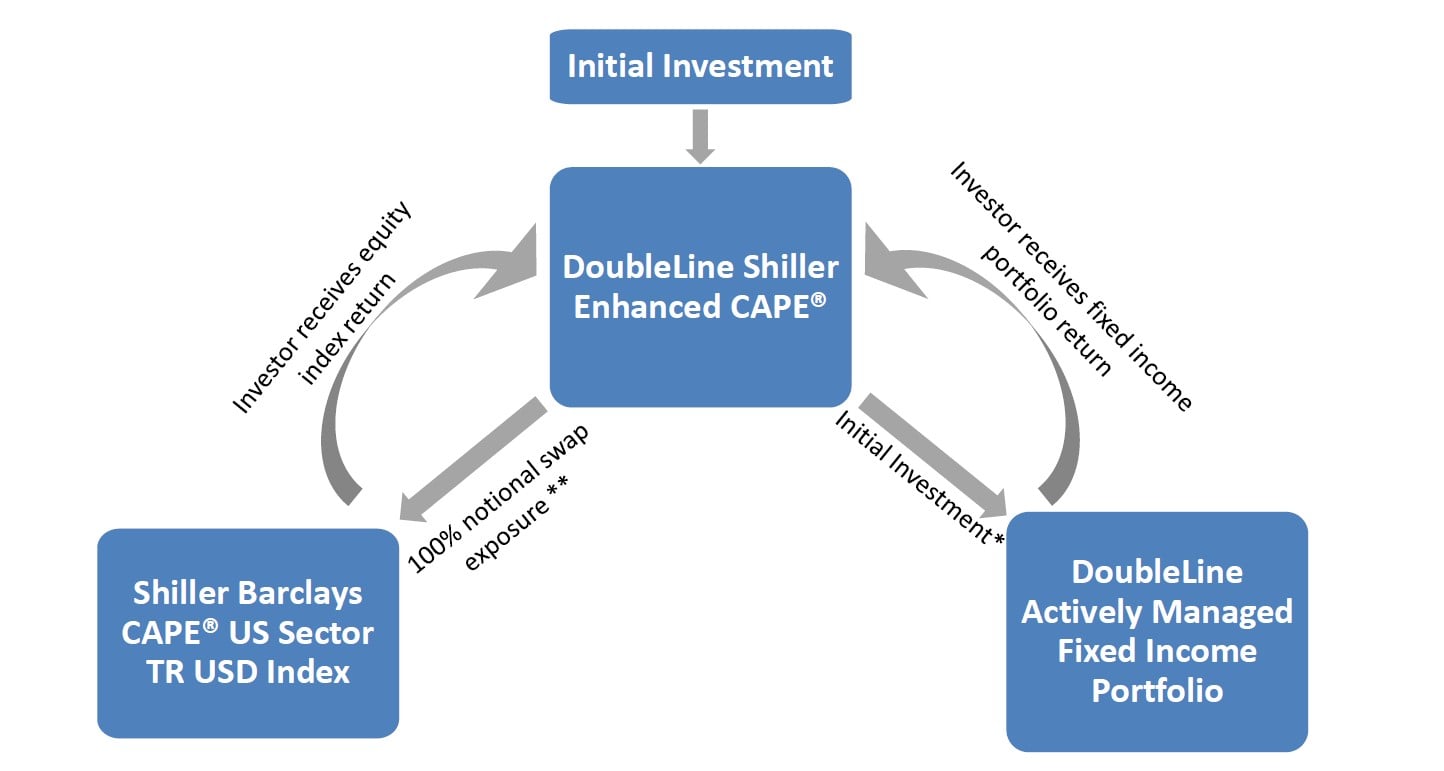
* A portion of the Initial Investment may be pledged as collateral under the swap
** Market fluctuations may preclude full $1 for $1 exposure between the swaps and the fixed income portfolio
What is the CAPE® Ratio?
- Acclaimed value investors Benjamin Graham and David Dodd noted in Security Analysis that equity valuations tend to follow a business cycle of 3-7 years
- The CAPE® Ratio was formulated in the seminal 1988 piece1 from Professor Robert Shiller and John
Campbell. - CAPE® = Cyclically Adjusted P/E (Price-to-Earnings)

- The CAPE® ratio seeks to assess longer term equity valuation by using an inflation adjusted earnings horizon that is 10 times longer than the traditional P/E measure
- Similar to the traditional P/E the CAPE® can be applied to a portfolio of equities, a sector or a broad based index
Inflation = the rate of change of prices calculated on a monthly or annual basis.
P/E = Price Earnings Ratio is the valuation ratio of a company’s market value per share divided by the company’s earnings per share (EPS).
Shiller Barclays CAPE US Sector TR USD Index incorporates the principles of long-term investing distilled by Dr. Robert Shiller and expressed through the CAPE® (Cyclically Adjusted Price Earnings) ratio (the “CAPE® Ratio”). It aims to identify undervalued sectors based on a modified CAPE® Ratio, and then uses a momentum factor to seek to mitigate the effects of potential value traps. You cannot invest directly in an index.
1. Campbell, J. Y., and R. J. Shiller, “Stock Prices, Earnings, and Expected Dividends,” Journal of Finance, 43:3, 661-76, 1988
Relative CAPE® Indicator
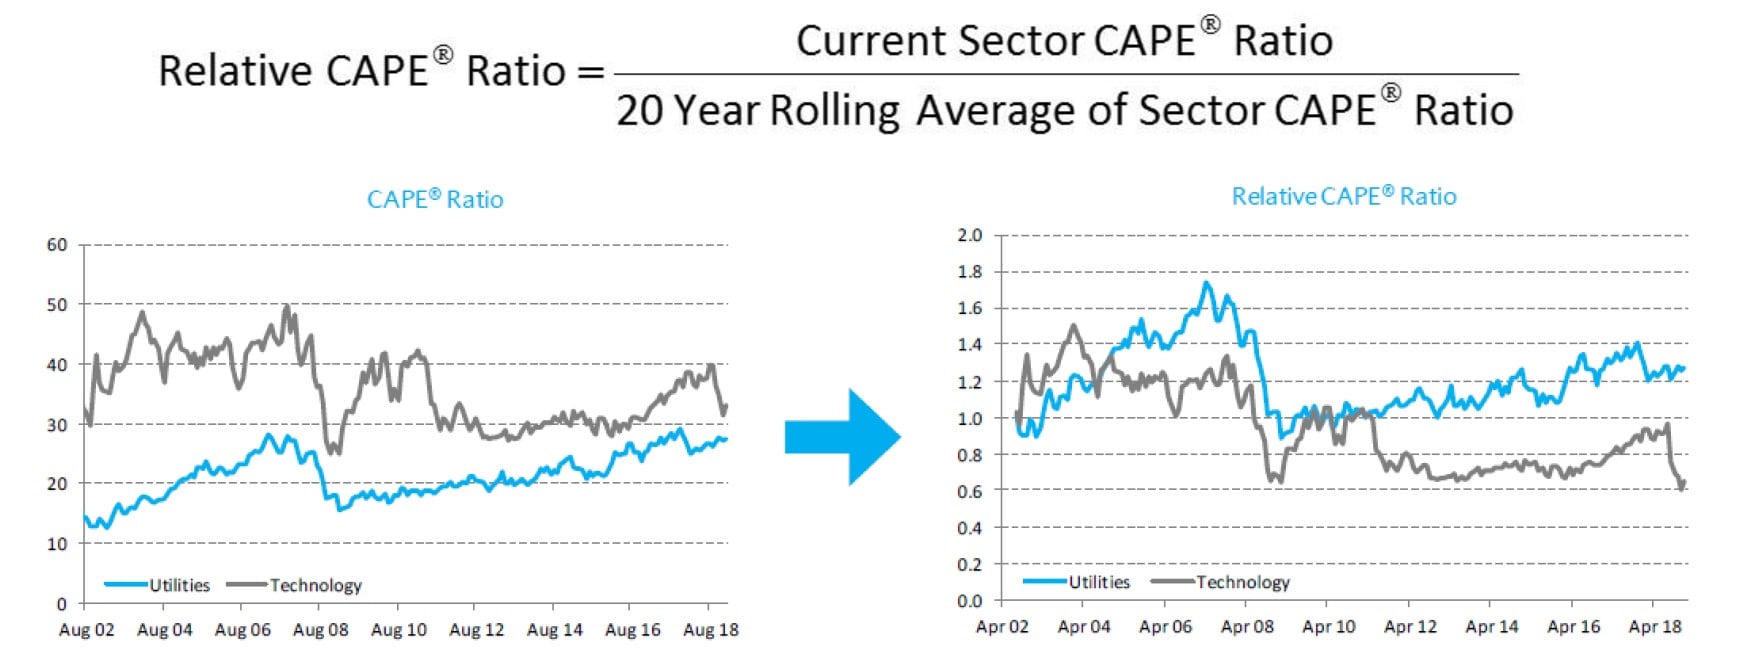
- To account for idiosyncratic differences between sectors where CAPE® Ratios have historically been of different magnitudes one can construct a Relative CAPE® Ratio
- This may allow investors to compare sector valuations on a level playing field
- The Relative CAPE® Ratio is used to compare relative valuation among equity sectors
Source: Changing Times, Changing Values: A Historical Analysis of Sectors within the US Stock Market 1872-2012, Oliver D. Bunn and Robert J. Shiller, September 4, 2012. Data updated through 2018 from Barclays.
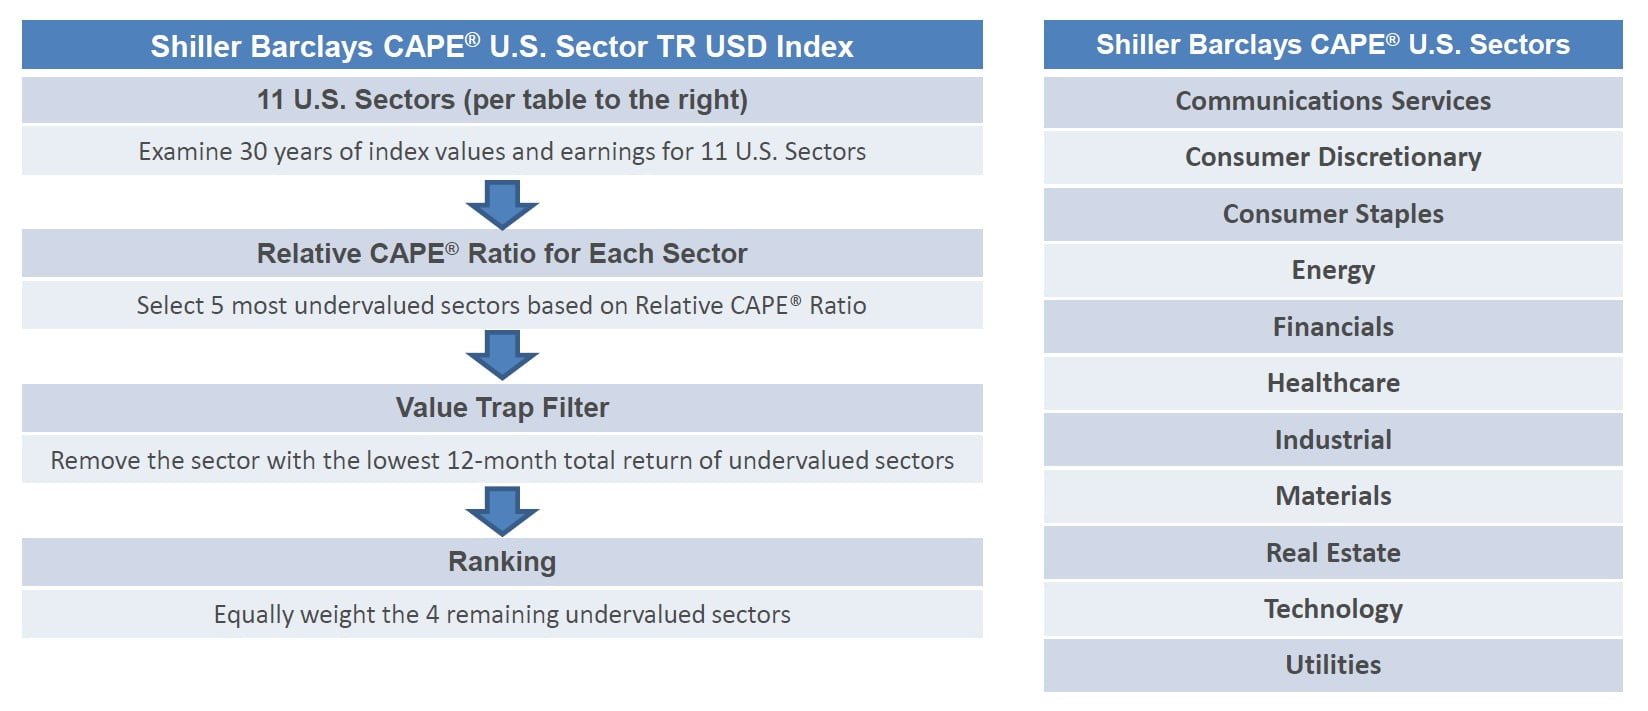
Shiller Barclays CAPE® U.S. Sector Index Sector Selection Rules
Source: DoubleLine, Barclays
CAPE = Cyclically Adjusted Price Earnings
Shiller Barclays CAPE U.S. Sector Index = Shiller Barclays CAPE US Sector TR USD Index incorporates the principles of long-term investing distilled by Dr. Robert Shiller and expressed through the CAPE® (Cyclically Adjusted Price Earnings) ratio (the “CAPE® Ratio”). It aims to identify undervalued sectors based on a modified CAPE® Ratio, and then uses a momentum factor to seek to mitigate the effects of potential value traps. You cannot invest directly in an index.
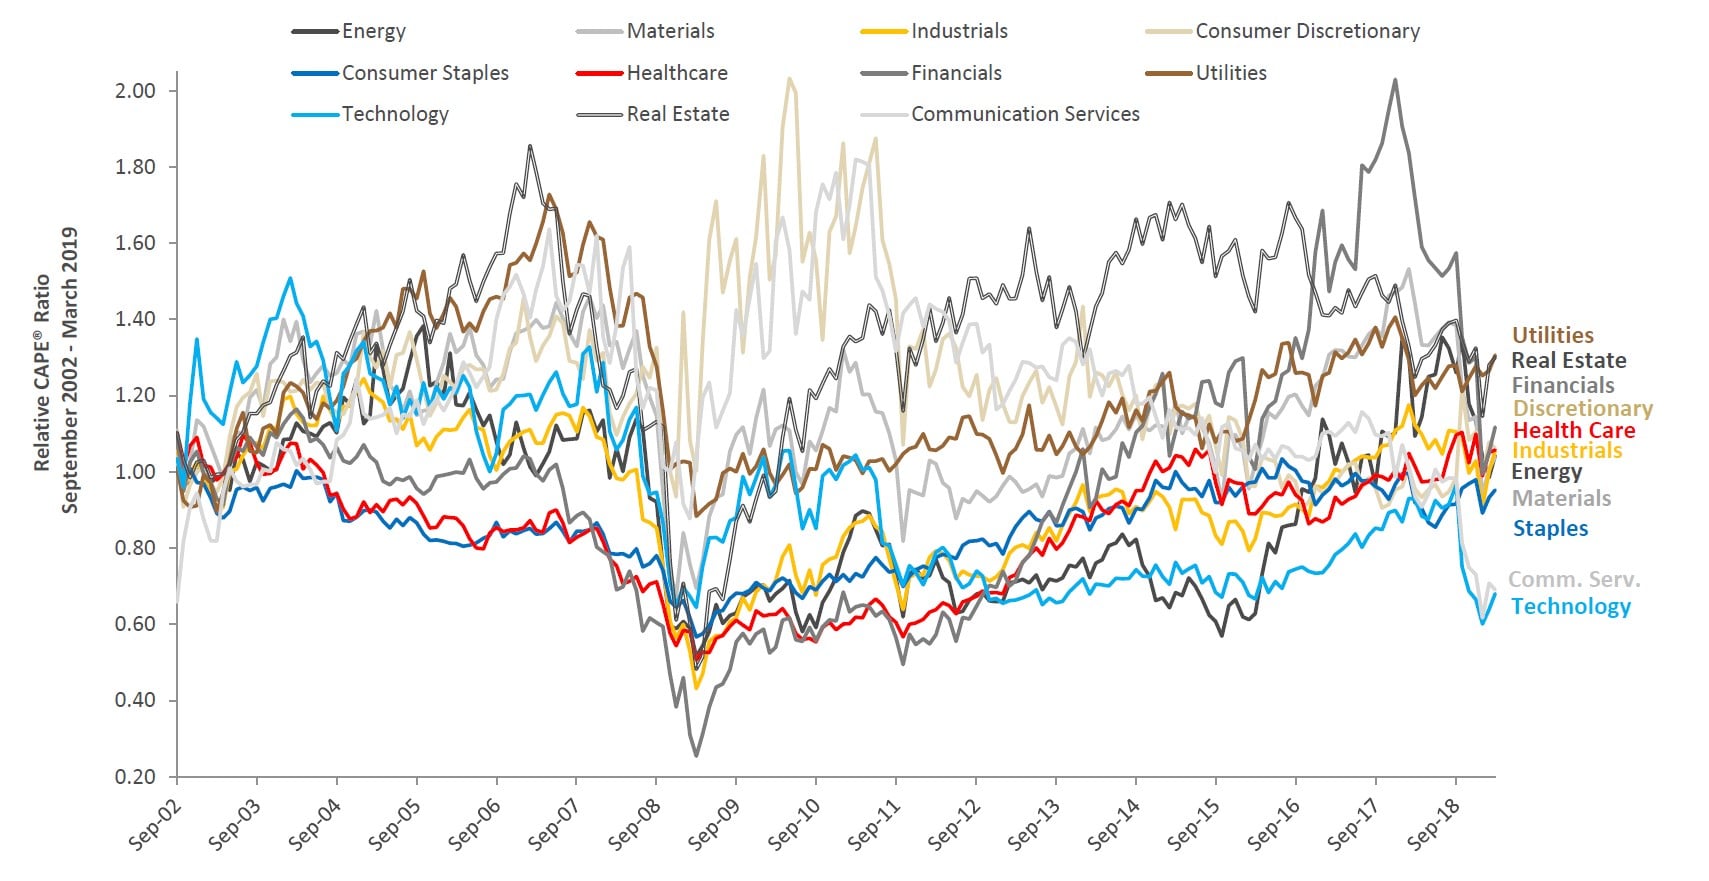
Relative CAPE® Ratio for Value Investing U.S. Sectors
The Shiller Barclays CAPE® U.S. Sector Index uses the Relative CAPE® Ratio to select the most undervalued sectors in the market
Source: Barclays, DoubleLine
In the chart, the vertical axis represents the Relative CAPE® Ratio. For definitions, please see the Appendix section of this presentation. For illustrative purposes only.
Historical Sector Rotation of Shiller Barclays CAPE® U.S. Sector Total Return Index
Portfolio weights are reconstituted on a monthly basis using the Relative CAPE® Ratio

Source: Barclays, DoubleLine.
Shiller Barclays CAPE ®US Sector TR USD Index incorporates the principles of long-term investing distilled by Dr. Robert Shiller and expressed through the CAPE® (Cyclically Adjusted Price Earnings) ratio (the “CAPE® Ratio”). It aims to identify undervalued sectors based on a modified CAPE® Ratio, and then uses a momentum factor to seek to mitigate the effects of potential value traps. You cannot invest directly in an index. Please see the Appendix for index definitions.
Performance of Shiller Barclays CAPE® U.S. Sector Total Return Index
October 31, 2013 – April 22, 2019
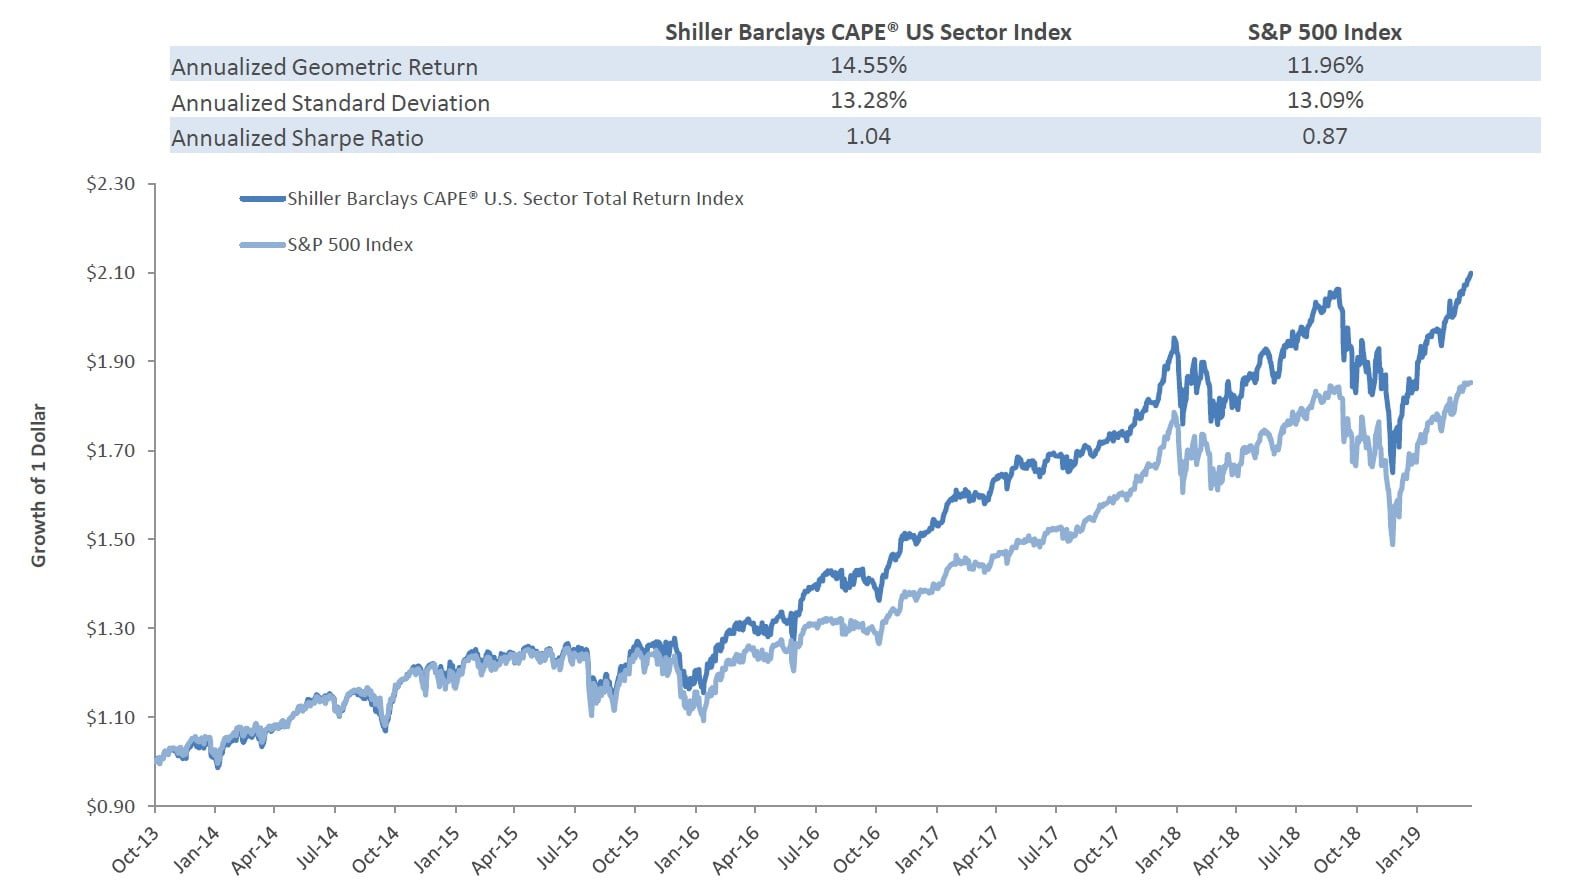
Source: Barclays, DoubleLine, Bloomberg
Past Performance is no guarantee of future results.
Please see the Appendix for definitions.
DSEEX Fixed Income Portfolio Characteristics
As of March 31, 2019
Duration: 1.09

Source: DoubleLine.
The credit quality of a particular security or group of securities does not ensure the stability or safety of the overall portfolio. Subject to change without notice.
DSEEX Fixed Income Portfolio Performance
October 31, 2013 – March 31, 2019
- The fixed income portfolio has generated a relatively consistent return in addition to the returns derived from the Shiller Barclays CAPE® index.
- This consistency, as opposed to inconsistent sources of alpha, is what distinguishes the DoubleLine double value proposition.
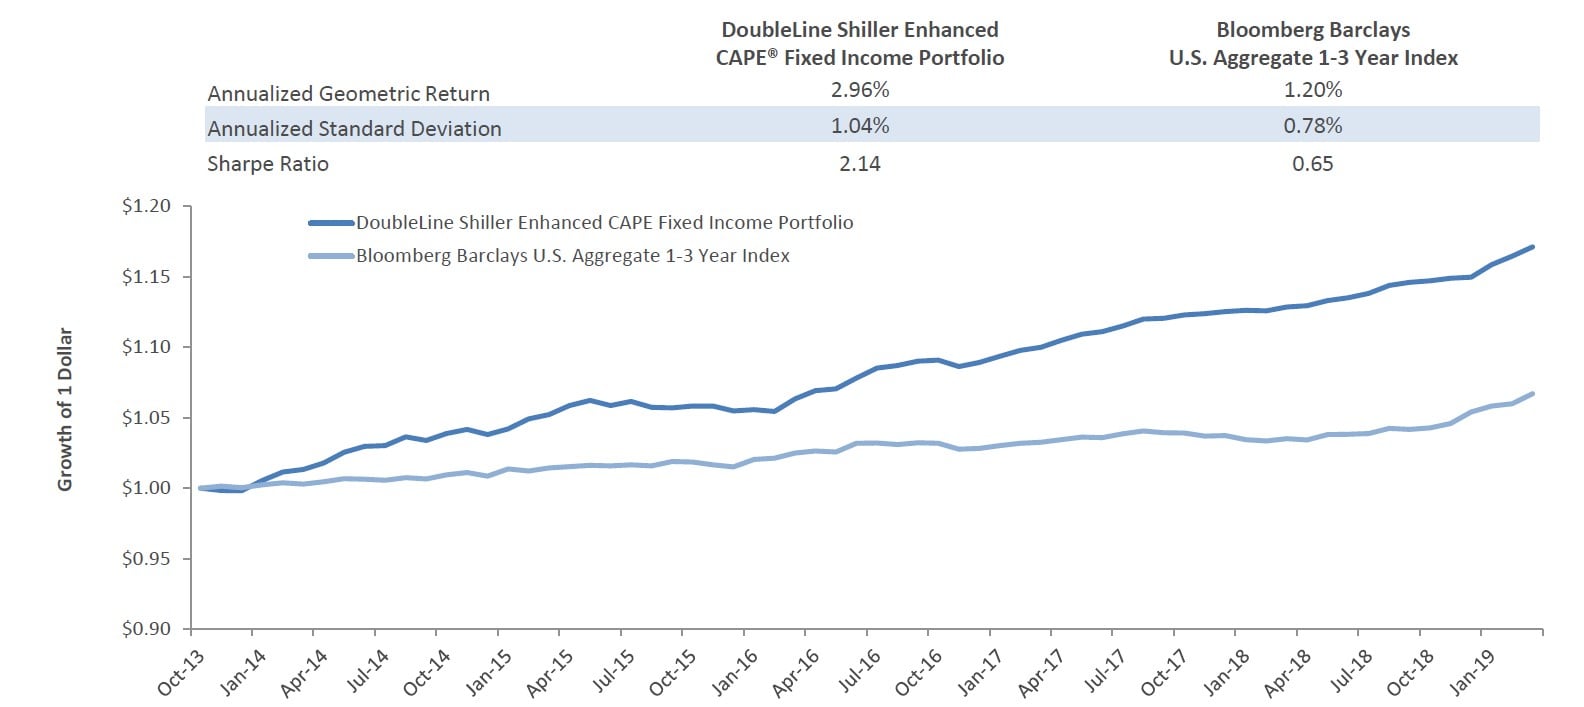
Source: DoubleLine
Performance data quoted represents past performance; past performance does not guarantee future results. The investment return and principal value of an investment will fluctuate so that an investor’s shares, when redeemed, may be worth more or less than the original cost. Current performance of the fund may be lower or higher than the performance quoted. Performance data current to the most recent month-end may be obtained by calling 213-633-8200 or by visiting www.doublelinefunds.com. The performance information shown assumes the reinvestment of all dividends and distributions.
This chart illustrates the performance of a hypothetical $1 investment made in the Fund as of October 31, 2013. Assumes reinvestment of dividends and capital gains, but goes not reflect the effect of any applicate sales charges or redemption fees. This chart does not imply future performance.
For more market trends, visit ETFTrends.com