 How budget shortfalls might best be addressed
By J. Richard Fredericks, Main Management
As Congress comes back from their recess, they will have a lot they want to accomplish, but they have an important must-do priority that can’t be ignored. The first piece of business they need to take up will be the country’s legal debt limit. The Bipartisan Policy Center (see here), the Congressional Budget Office (see here) and Treasury Secretary Mnuchin have all indicated that the country will no longer be able to meet its requirements in full, and on time, between early and the middle of October because the government will run out of its borrowing authority. That, in turn, would mean the United States would be in default of some of its obligations. The vote on the debt-ceiling, once again, could be contentious, as some members want to introduce conditions that would prevent a vote on a “clean” debt-ceiling bill. Even though the Republicans have control of the Executive and Legislative bodies, some in their party intend on attaching “conditions” to the bill by focusing on spending caps that are meant to address the country’s large, perennial budget deficits.
The President, the Republican leadership and the Republican party are consumed on making progress on healthcare, taxes and infrastructure, yet the overall budget picture still looms large in the background … as it always does.
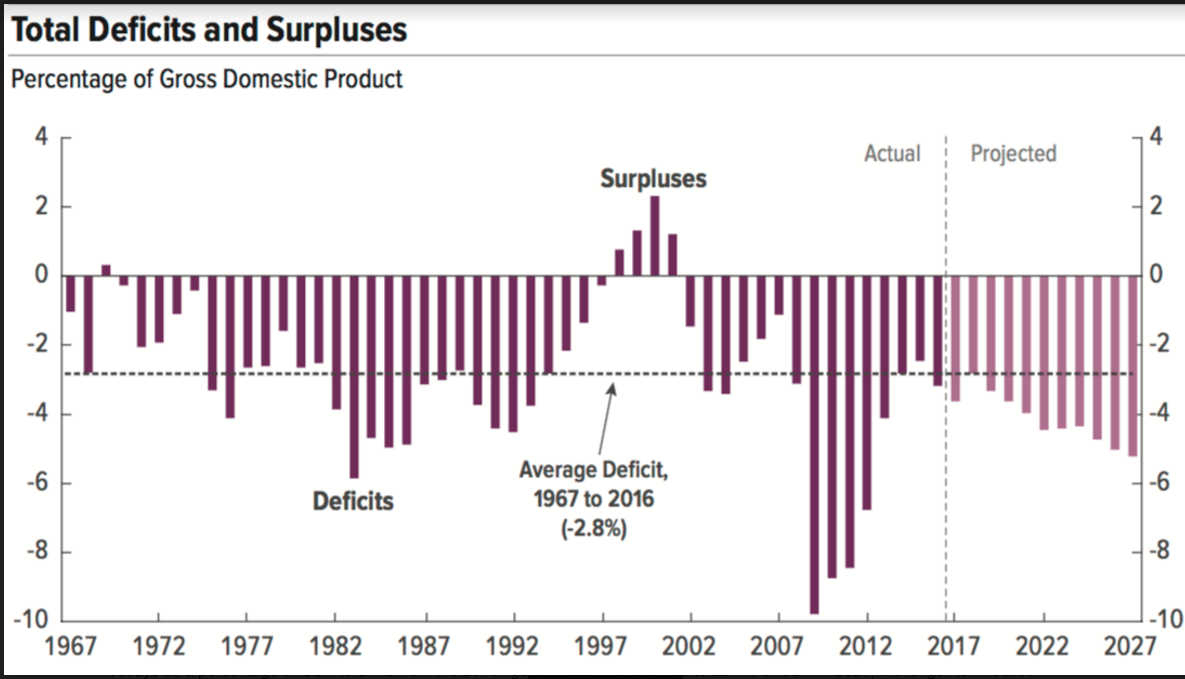
The Congressional Budget Office (CBO) is the official “scorekeeper” for budget history and budget forecasts as they typically produce 10 year projections and even make forecasts on the budget as far out as three decades into the future. The current CBO outlook for 2027 calls for a deficit that rises to 4.3% of GDP, from 3.2% of GDP in the 2016 fiscal year, and its 30-year outlook anticipates further budget deficit deterioration to 9.8% of GDP in 2047. The pictorial history of deficits and surpluses, as well as the CBO estimates out to 2027, follows.
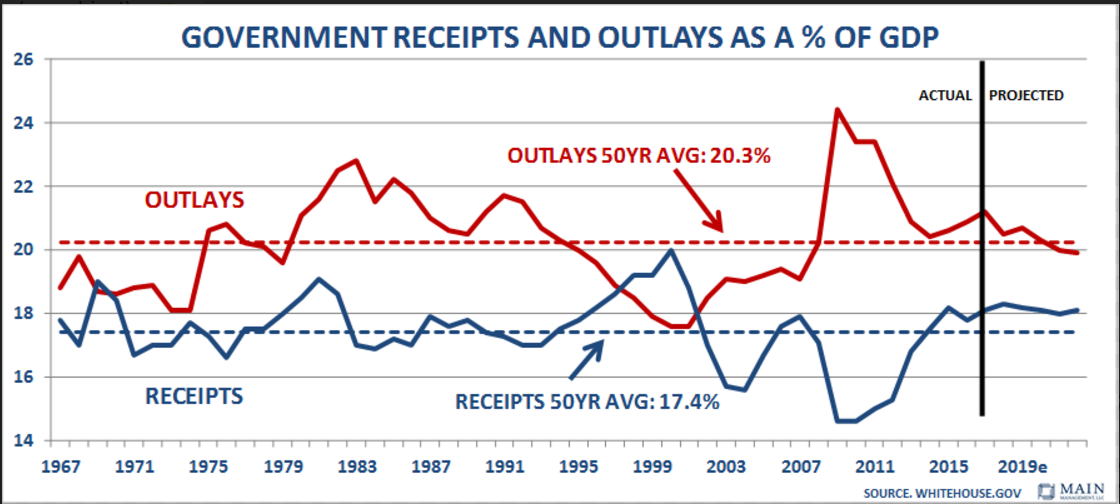
The long term and shorter term graphs below have been assembled from the Office of Management and Budget in the White House (see table 1.2 from here). What can be seen is that since World War II, tax revenues as a percent of GDP have been very consistent. The visual dips in receipts around 2002, and especially 2008-9, were caused by recessions while the higher numbers in the late 1990s were created by an especially strong stock market that lead to oversized capital gains revenues. That said, tax receipts have been remarkably consistent over the years. As a percent of GDP, receipts have averaged 17.3% since 1950, 17.4% for the 50-year period since 1966, and 17.2% over the past 25 years. According to the CBO, tax revenues as a percent of GDP are projected to grind higher from 17.8% in fiscal 2016 up to 18.4% in 2027.
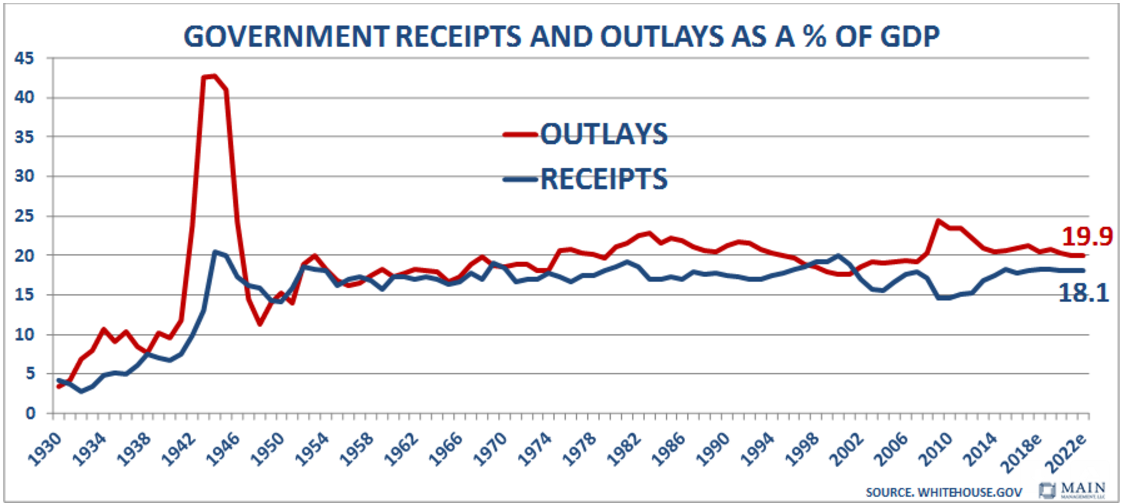
To the surprise of many, further analysis shows that despite tax reductions in the years 1964, 1983, 1986, 1997, or in 2003, for the three years following the reductions there was an improvement in the deficit in four of those five occasions. The lone exception was the three-year period after 1964 when the deficit relative to GDP remained essentially flat, going from -0.9% of GDP to -1.0% three years later.
On the other side of the equation, when taxes were increased in 1967, 1969, 1990, 1994, or in 2013, the deficit picture improved but was much less noticeable. Out of the five observations where taxes were increased, two of those occasions resulted in worse levels of deficits to GDP three years later and, in three instances, the deficit relative to GDP improved.
The intensity of the change over the measured periods, however, definitely favors tax cuts over tax increases, which, in general, means that the economy and the overall budget benefits more from lower tax rates.
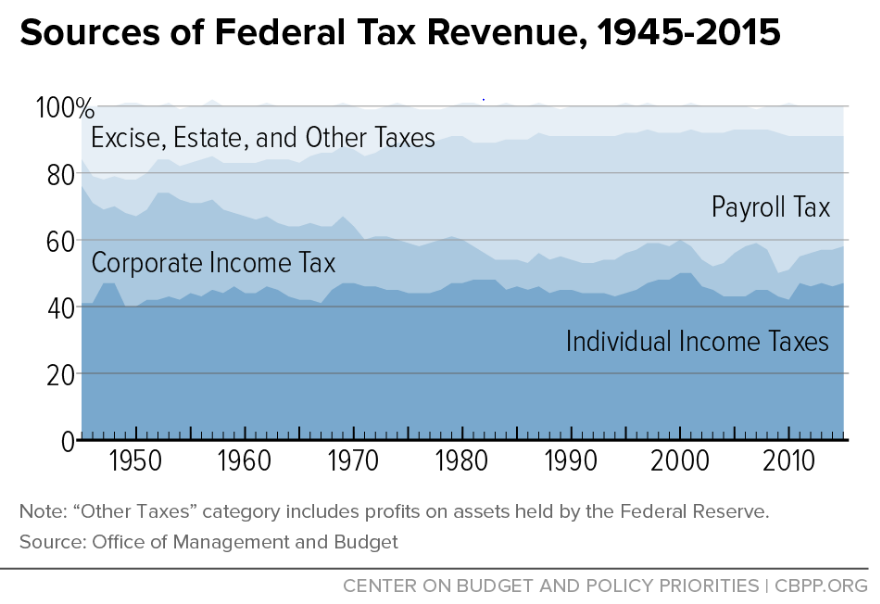
The mix of government tax receipts by source is shown below. Revenues from individual income taxes has been remarkably stable over time, while revenues driven by corporate taxes have diminished, and lower amounts of revenues generated by “excise, estate, and other” taxes have been replaced by higher payroll taxes.

In the title of these remarks, we mimicked James Carville who famously said … “It’s the Economy, Stupid”. In our mind, spending has been the primary culprit for the expanding the deficit problems to this point and will be the catalyst for expanding deficits far into the future.
We say that because projected long-term deficits in our country are not a function of revenues that are too low. As noted above, revenues are projected to rise higher than the 2016 results and are expected to rise above the 50-year average over the next 10 years. The real culprit is a much more rapid advance in outlays. The CBO projects that spending as a percentage of GDP will climb 1.5 points from the 2016 figure of 20.9% of GDP up to 22.4% of GDP in 2027 and then soar another 7.6 points to nearly 30% of GDP over the next few decades as can be seen below.

As a result, the CBO expects deficits to balloon in the next three decades from 2.9% of GDP in 2017 all the way up to 9.8% in 2047, again, because spending growth is projected to far outpace the growth in revenues, as is evident in the panel above.
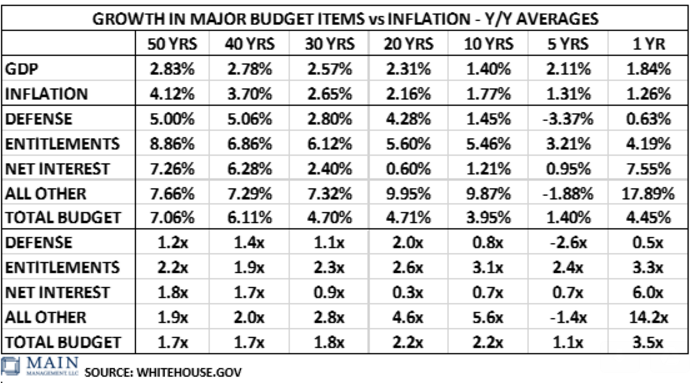
As can be seen in the following chart, the cold reality is that deficit spending appears to be built into the psyche of Congress as spending (particularly entitlements), has increased faster than GDP in every period over the past 50 years! The overall growth in spending came even though President Clinton was able to bend the growth curve down from a reduction in defense spending after the large Reagan buildup at the end of the Cold War and when President Obama purposefully cut back even more on defense spending during his two terms. The overall trend is clearly unsustainable.
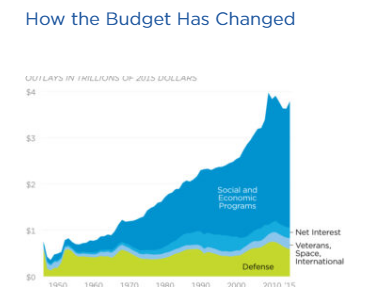
The sources of the rapidly expanding future outlays reflect increases in Social Security, other major health care programs (primarily Medicare), and interest on the government’s debt. The spending growth for Social Security and Medicare, in turn, is the result of our nation’s aging population. As members of the baby-boomer generation continue to age, and, as life expectancy continues to advance, the percentage of the population which is 65 or older will grow sharply, thereby boosting the number of beneficiaries of the entitlement programs
The CBO projects that health care costs will rise more slowly than they have in the past, in part because of the effects of new medical technologies and rising personal income. Given the current stalemate on Obamacare and the continued rapid growth in the cost of healthcare, we are not confident in the CBO projection, as least as it relates to inflation and GDP. All one needs to do is view the two panels below from the CBO to see that health care and other social programs are having an outsized impact on the budget and then view the long term growth in Social Security and Medicare in the table that follows.


The CBO predicts nearly a double in the net interest cost on Federal debt between now and 2022. The cost of the debt was $240 Billion in fiscal 2016 and expected to be $276 billion in fiscal 2017. The expectation in 2022 moves up by nearly $250 billion to a level of $528 billion as the CBO factors in more debt and higher interest rates. The current Federal debt in public hands is $14.36 trillion, which means that every 100 basis points, plus or minus, amounts to $143 billion. Thankfully, the government has extended debt maturities from the bottom of the last cycle and the maturity now stands at around 70.8 months. What could help given the current low interest rates, would be a program to further extend maturities by selling 50 year or even 100 year obligations. We understand that strategy is under consideration.
Interestingly, when President Clinton was in office, he presided over four years of budget surplus, an accomplishment that benefitted from revenues that were higher than normal, at 19.3% of GDP, reflecting a very strong stock market with attendant high capital gains taxes. More surprising, however, was the level of expenses at the time, which were held to much lower levels relative to GDP, at only 17.9%. Shortly thereafter, the deficit eroded by 4.5 percentage points as revenues as a percent of GDP reverted to more normal historical levels by going down 1.5% points to 17.8% of GDP, while expenses soared, jumping 3.0% points relative to GDP, from 17.9% to 20.9%. Consequently, the country moved back into a deficit position in 2002 and has remained that way ever since, averaging 4.2% of GDP since 2002, with the expectation that deficits will continue and sharply accelerate from current levels.
Some pundits will no doubt call for tax increases to plug the budget shortfall by more heavily taxing “millionaires and billionaires”. The problem with that strategy is that it is becoming mathematically impossible to have much of an impact on the deficit by taxing the rich much more.
How can that be, one would ask?
If the government were to take 100%, or ALL of the INCOME earned by taxpayers in excess of $1 million, that extra amount would fund the federal government for less than three months (2.8 months by our calculations). If the government were even more aggressive and took ALL income above $500,000, it would fund the federal government by only an extra two weeks or so (calculated from “Statistics of Income (SOI) from the IRS – the 2016 report can be found here, page 28).
The reason that taking all of taxpayer’s income over $1 million would have such a small impact on the budget deficit is due to the progressive nature of the United States income tax code. While dated, the OECD noted in 2008 that the United States “has the most progressive tax system of all of its nations and collects the largest share of its taxes from the richest 10% of the population.” The higher taxes imposed by the Obama Administration on the upper income earners have made the tax code even more progressive.

