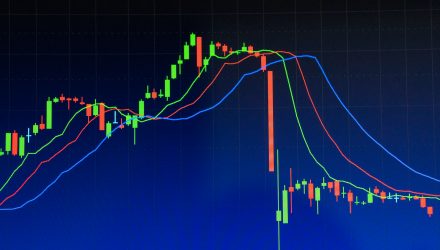
Equity markets have had a wild ride in 2020, with stocks climbing to all-time highs across the board, only to plummet below 2018 lows with roughly a month, and then rally back to October 2019 highs within nearly another month.
All of this back and forth has many investors frustrated or elated, while volatility has gone from tepid, to boiling, and now reached a calm that seems ready to boil over at any minute.
Stocks finished the month well off the highs made Wednesday, as stocks reached some technical levels, and joblessness continued to surge. But one thing that has not been discussed as much lately, is how the CBOE Volatility Index or VIX, often referred to as the pain index, had done anything but induce pain lately, possibly suggesting that that may be about to change.
As stocks continue to selloff into the extended session trading, a peek back at the VIX shows that it has gone from over 85 to under just above 30 in a little over a month. This is a warp-speed transition in comparison to 2008 for example when it took three to five months for a decline from similarly lofty heights to reach levels near 30.
All this may be suggesting that we may be due for a dramatic bounce in the VIX, which typically trades inversely to stocks, and therefore could portend a substantial downdraft, something that many analysts have been expecting for some time now, as just this week, on Tuesday and Thursday the VIX rallied from roughly 30.5 to 36, an 18% increase in just a couple of days. The iPath Series B S&P 500 VIX Short-Term Futures ETN (VXX) gained 3.17% Thursday amid the move.
“As we all know, no market moves in a straight line,” Matthew Maley, chief market strategist at Miller Tabak, said in a note Thursday. “The damage that was done in the first (37%) decline…and the recession that is upon us…could cause another round of selling before too long … History tells us that the odds of another deep decline are very, very high.”
Not everyone fears a collapse in stocks, however, as a month ago, when the U.S. stock market was still reeling from its fastest collapse in history, BTIG Chief Equity and Derivatives Strategist Julian Emanuel offered some investors some prescient advice.
He told them to observe the market’s “fear gauge” for clues as to whether the fledgling rebound was the beginning of a genuine recovery or just a bear market rally. For Emanual, a calm VIX, one that trades below 50 could confirm that a bull market is in place and stocks have indeed formed a bottom.
The VIX ended the session beneath 50 on April 3 and has remained there since. The “fear gauge” has closed below 50 for 17 consecutive trading days. At last check, the VIX was holding near 34 on Thursday.
The Cboe Volatility Index, or VIX, closed below its second-month future on Monday for the first time since Feb. 21, reverting to a more typical structure. Since contracts dated further out would tend to hold more uncertainty than those closer in, they would normally trade higher, which hadn’t been the case in recent weeks because of the enormous concern caused by the spread of COVID-19 and consequences for public health, economies and financial markets.
Similarly, the S&P 500 Index’s three-month call implied volatility climbed above its 30-day volatility on Friday, a phenomenon that bodes well for equities in the medium term, Susquehanna Financial Group LLLP noted.
“Since 1990 there have been 11 times SPX term structure (90-day/30-day) closed over 1.0x for the first time in 30 days,” Susquehanna derivatives strategist Chris Murphy wrote in a note Monday. “The index is relatively flat for the first two weeks afterward and finishes one month later up on average 85 basis points.”
For more market trends, visit ETF Trends.