As a matter of course, I’m used to examining flows into ETFs to get some insight into investor sentiment. It’s a far from perfect proxy. After all, when we say “XYZ fund had $1 million in flows” we’re not saying “Bob and Alice bought $1 million! Sentiment!” What we’re saying is that there was enough of a disconnect between the price Bob and Alice were willing to pay and the fair value of XYZ for an Authorized Participant to go through the hassle of making new ETF shares: buying up underlying securities, turning them into the issuer, and getting new shares to sell. That’s the mechanics.
Still, as low-frequency data goes, I think it’s useful (as high-frequency data, say, daily, it can be full of noise, which is why I will shout from the rooftops not to use flows as “signal” until I’m blue in the face.)
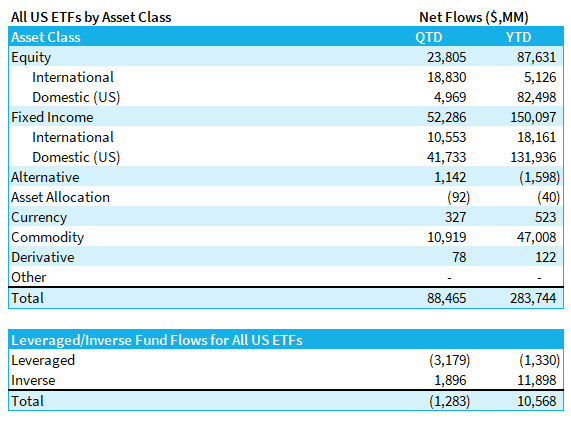
So what do flows tell us? Here’s the chart of Year-to-Date and Quarter-to-Date flows.

On the surface we can glean a few quick things here: First, the overall flows of $284 billion are stellar. We’re basically on track to meet or beat the best year ever for ETF flows ($452 billion in 2017). But that really just tells us what we already know: in times of volatility, people ditch their underperforming traditional active mutual funds and buy low-cost ETFs when they decide to re-enter the market. It’s happened in every downturn since the dotcom bubble burst.
Perhaps more interesting is the mix here: Investors strongly favored domestic equities until quite recently, when they reallocated strongly into international equities. Commodities have remained strong all year, driven primarily by $37 billion in new money going into Gold ETFs, and another $8 billion into oil.
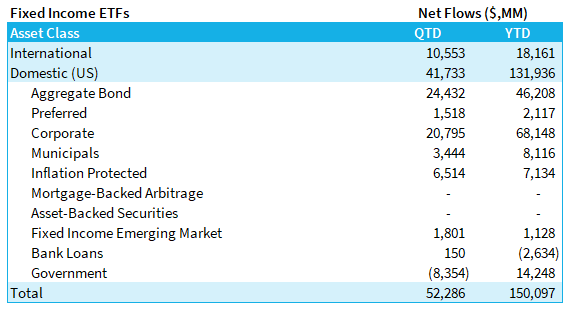
But by far the most interesting spin is how investors have strongly favored fixed income, and that trend has continued nearly unabated month after month. But this ain’t advisors building bond ladders, it’s much more interesting than that:

The Aggregate Bond allocations make sense — that’s just investors parking cash into default bond ETFs. The $68 billion into corporates, however, is in my recollection unprecedented since Bond ETFs first became a thing in the early 2000s.
And I know what you’re thinking: “Dave, this is all the Fed! They’re buying corporate bond ETFs!!” But it doesn’t quite match. The Fed’s Secondary Market Corporate Credit Facility didn’t kick into gear until well into May — as of their April report it was still not operational. So let’s look at what the fed actually owns, as of the end of August, and how that compares to the flows for those funds:

I’ve included the flows for the full year just to help tell the story. As of the end of August, the SMCCF owned $8.6 billion in 16 listed funds. In March, when the SMCCF was announced, money started coming into the “default” ETFs in the space and by April we were in full on “buy everything” mode across the complex. And while the Fed has indeed been a bit of a whale in some of the smaller funds, in aggregate, the fed has only been responsible for 18% of the flow since the program started.
More importantly, the Fed seems to have completely stopped buying. The August report shows no new transactions in corporate bond ETFs whatsoever. And yet, the Fed-16 continue to gain assets.
My conclusion: the Fed did exactly what it wanted to do here — buying just enough on the open market to convince the street that they would be the buyer of first and last resort, and bringing investors along for the ride. Whether this is good, bad or indifferent from a moral hazard and price discovery perspective will have to be settled over the long game. But short term? You’d have to say mission accomplished.
For more market trends, visit ETF Trends.
