

The key themes driving fixed income markets during 2022 were global inflation, aggressive Fed policy, and a growing prospect of recession. Employment and wage growth remained robust, but housing and demand weakened as the year progressed and the Fed’s policy actions began to take a bite out of the U.S. economy.
The ten charts below provide a broad view of economic and financial activity during the year.
Chart 1: No matter what measure of price growth you prefer, inflation ran blistering hot, requiring aggressive catch-up reaction from the Fed.
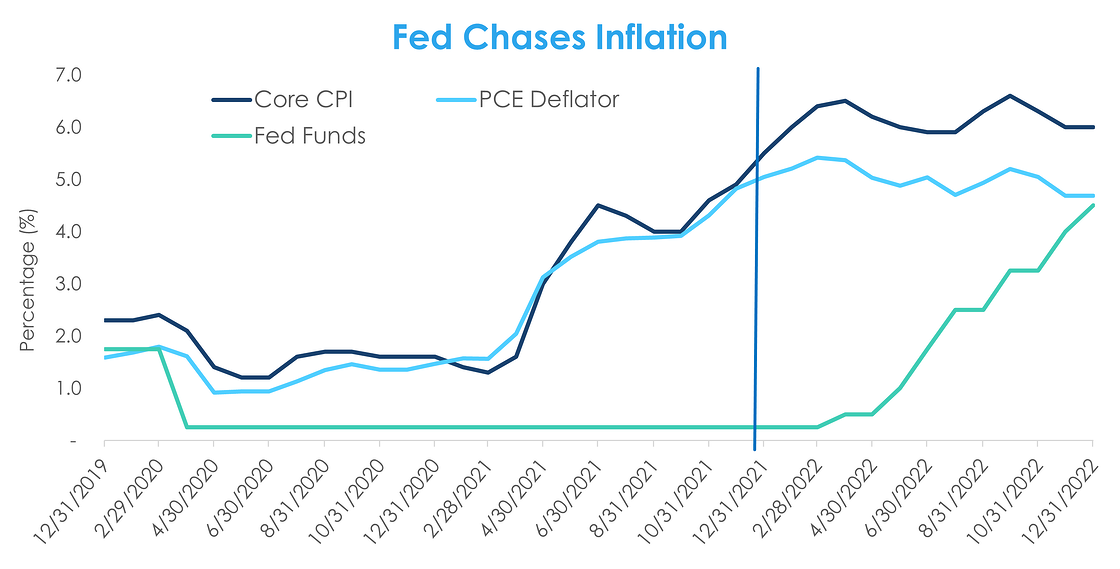
Chart 2: Interest rates rose sharply, and the yield curve inverted to a 40-year low.
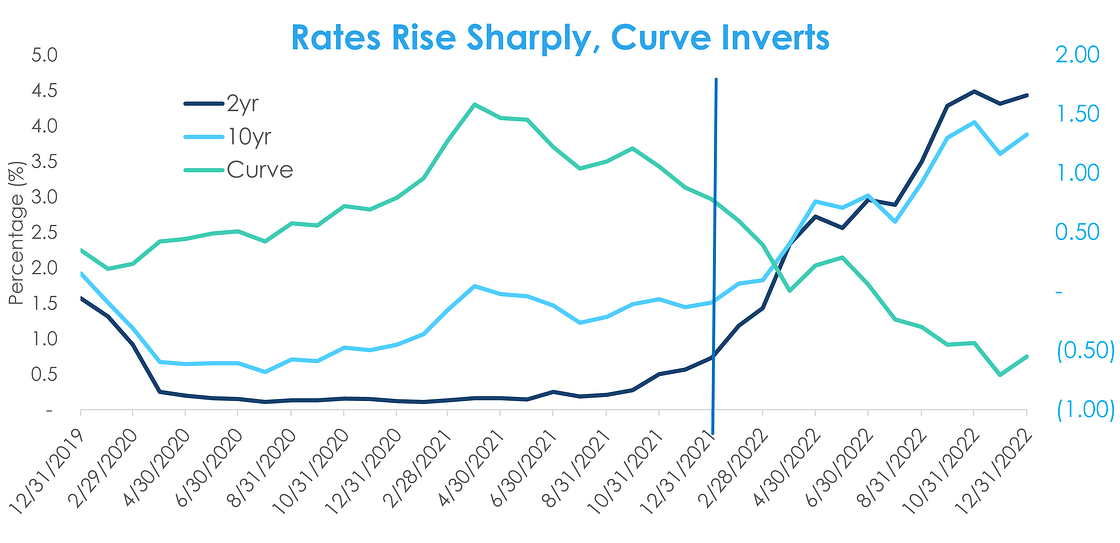
Chart 3: Meanwhile, supply chain issues improved after 2021 glitches.
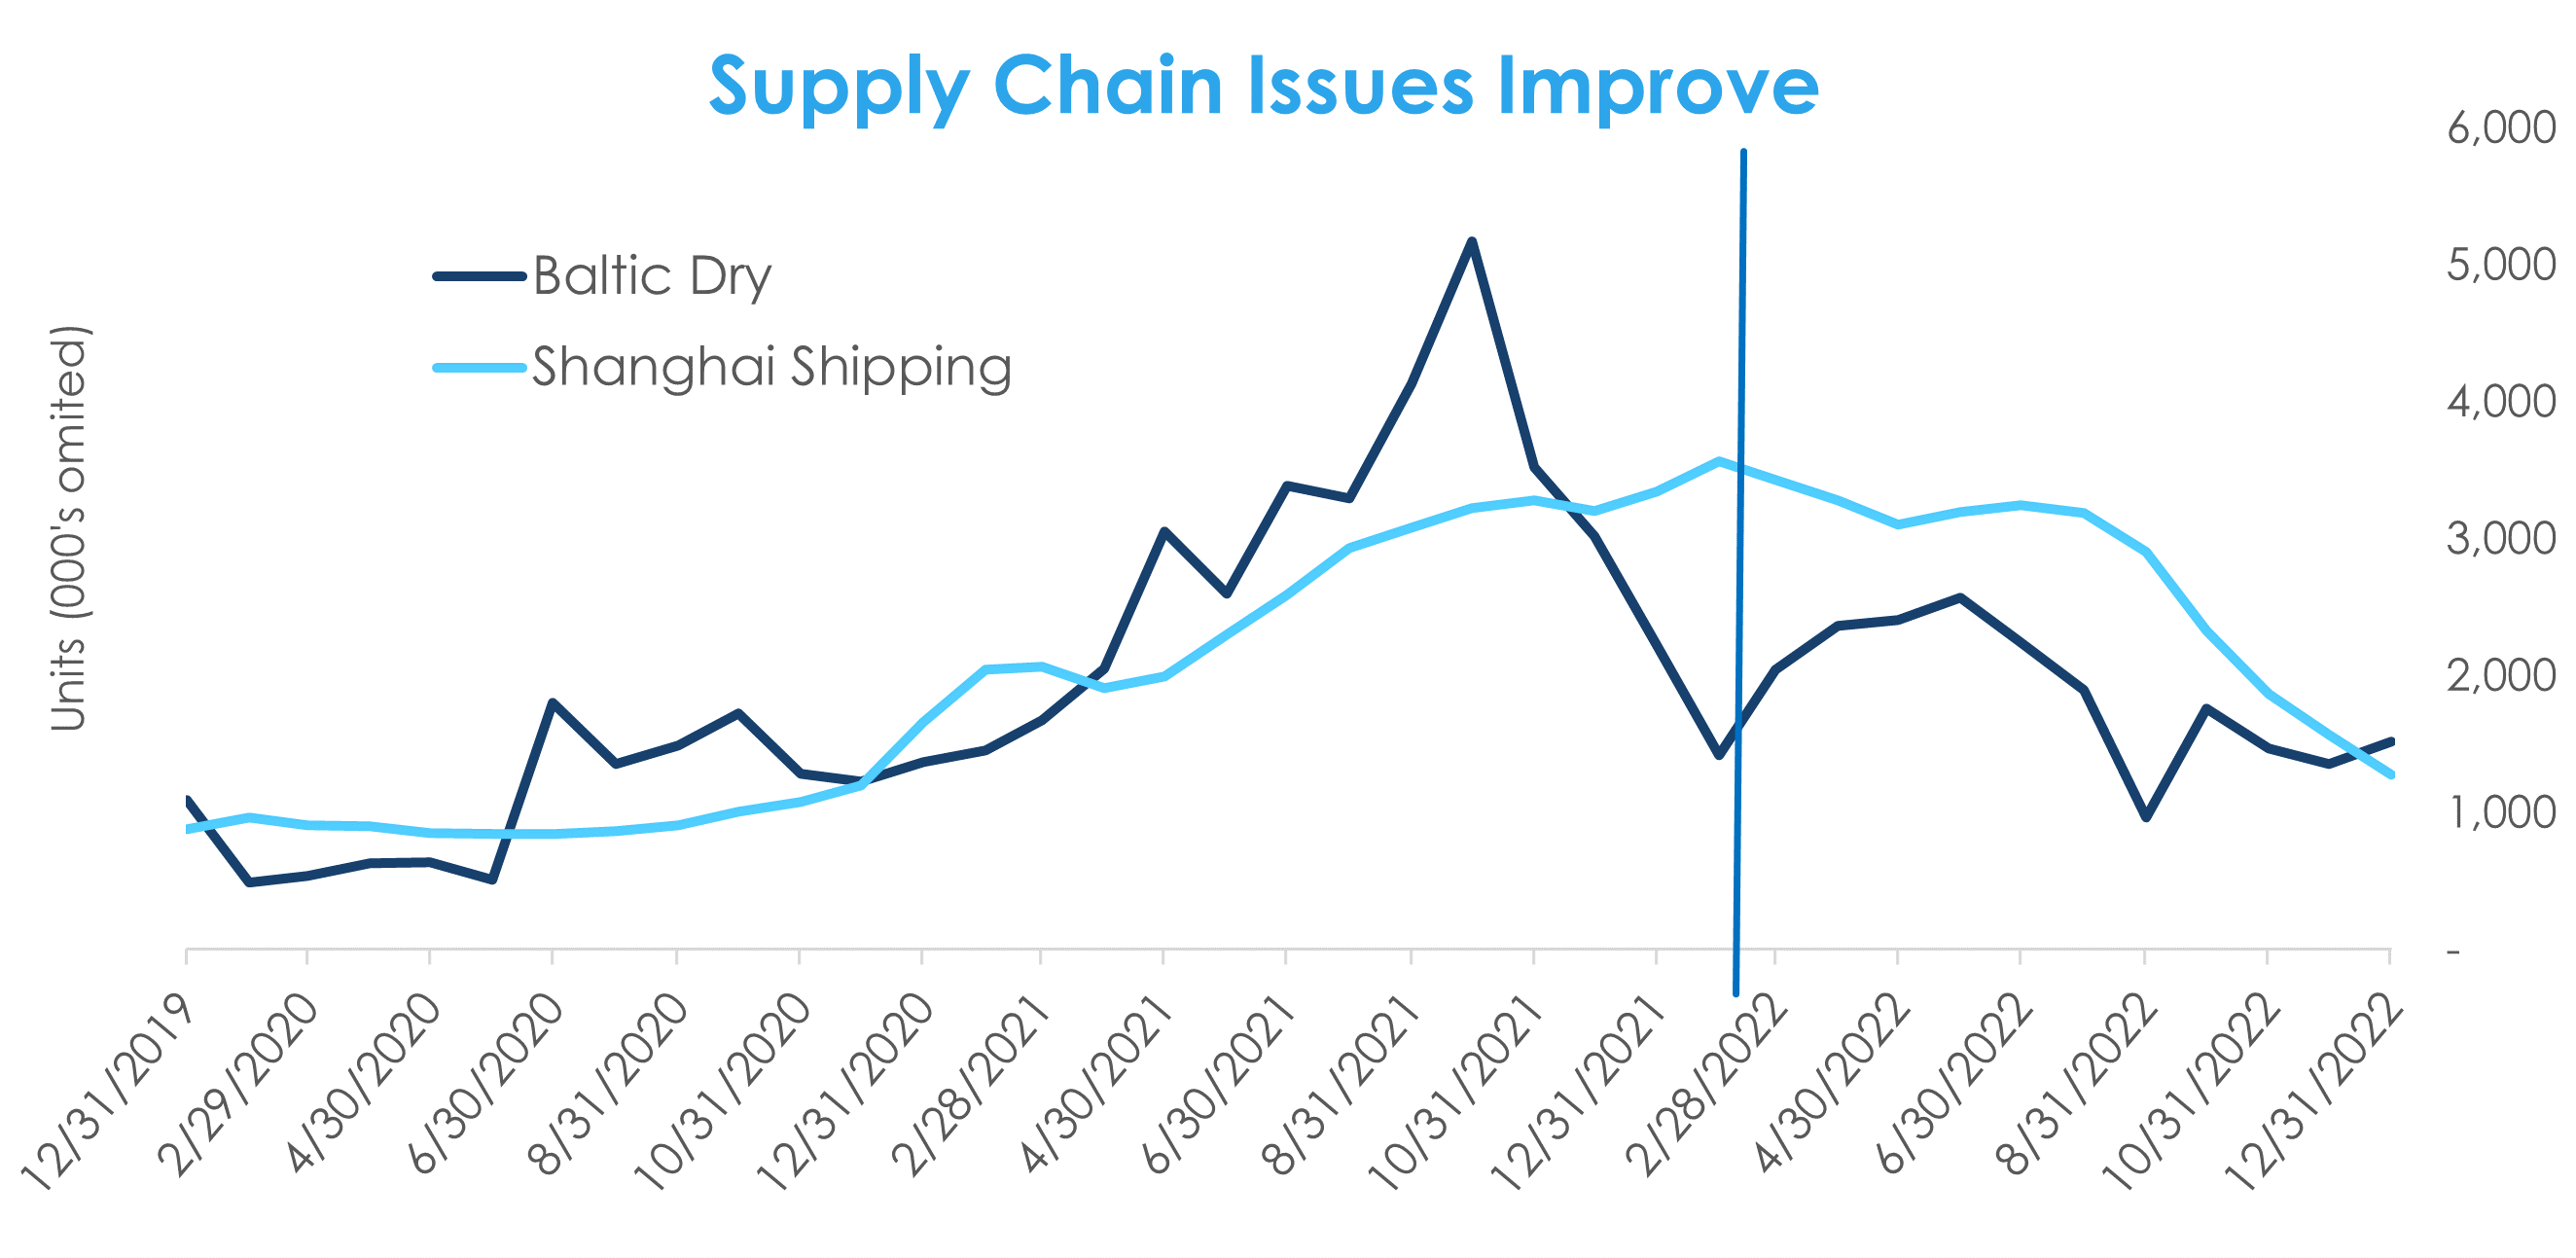
Chart 4: Home sales slowed due to higher financing rates
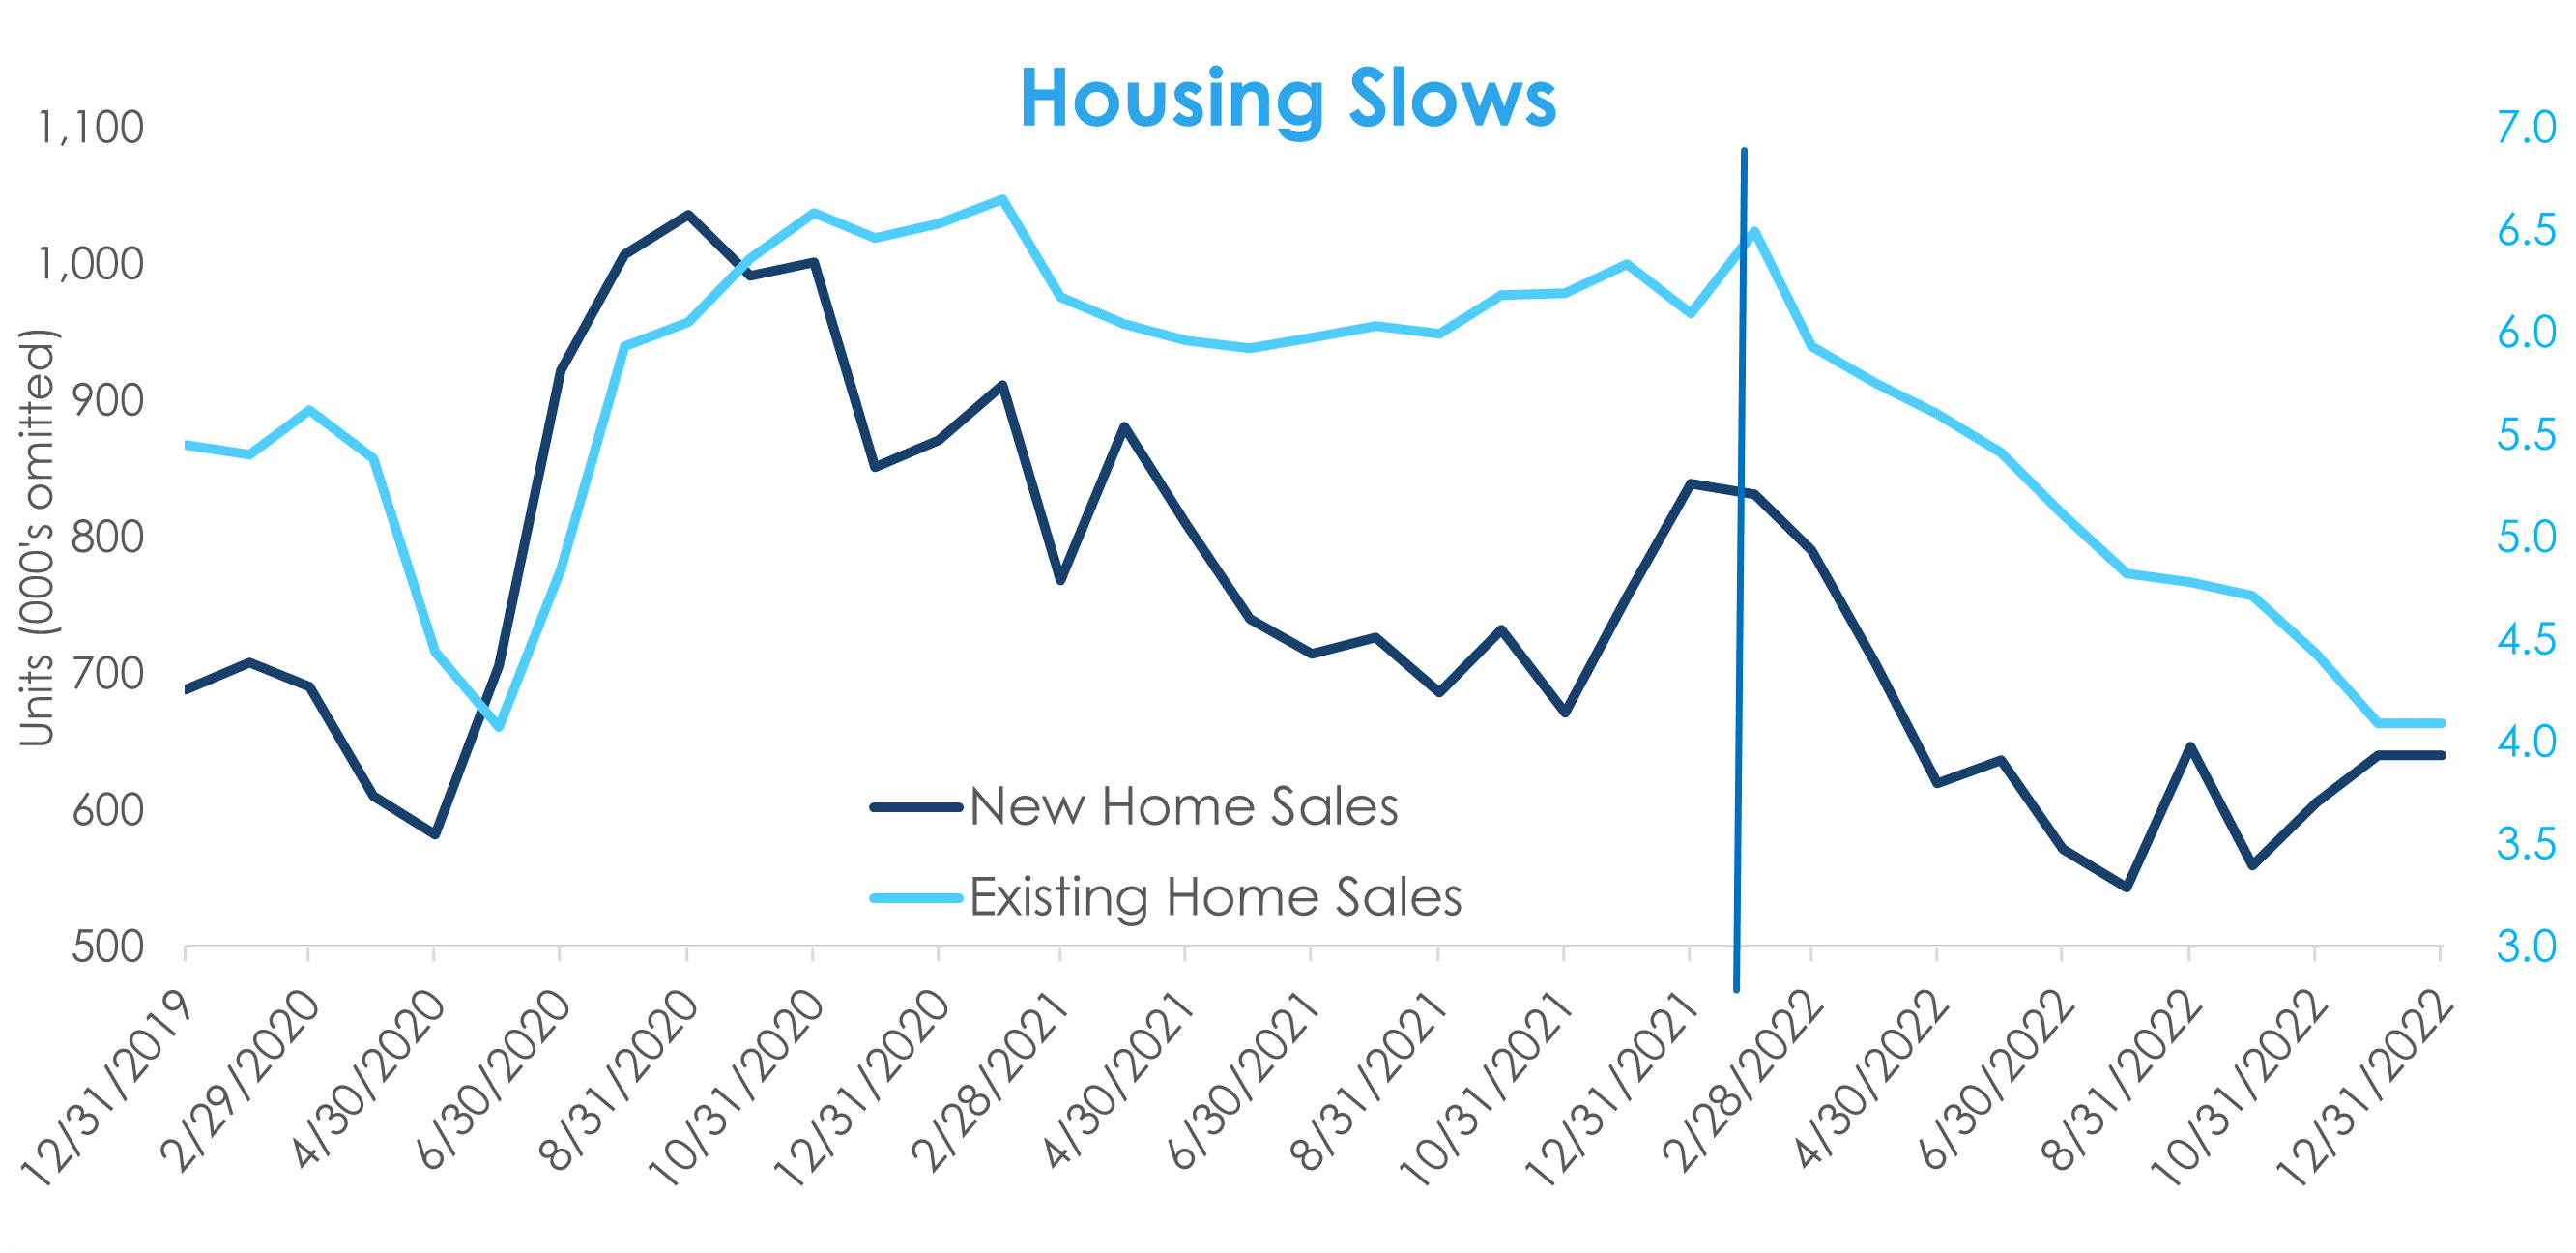
Chart 5: The jobs picture remained healthy, with unemployment below 4% and average hourly wages growing over 5%.
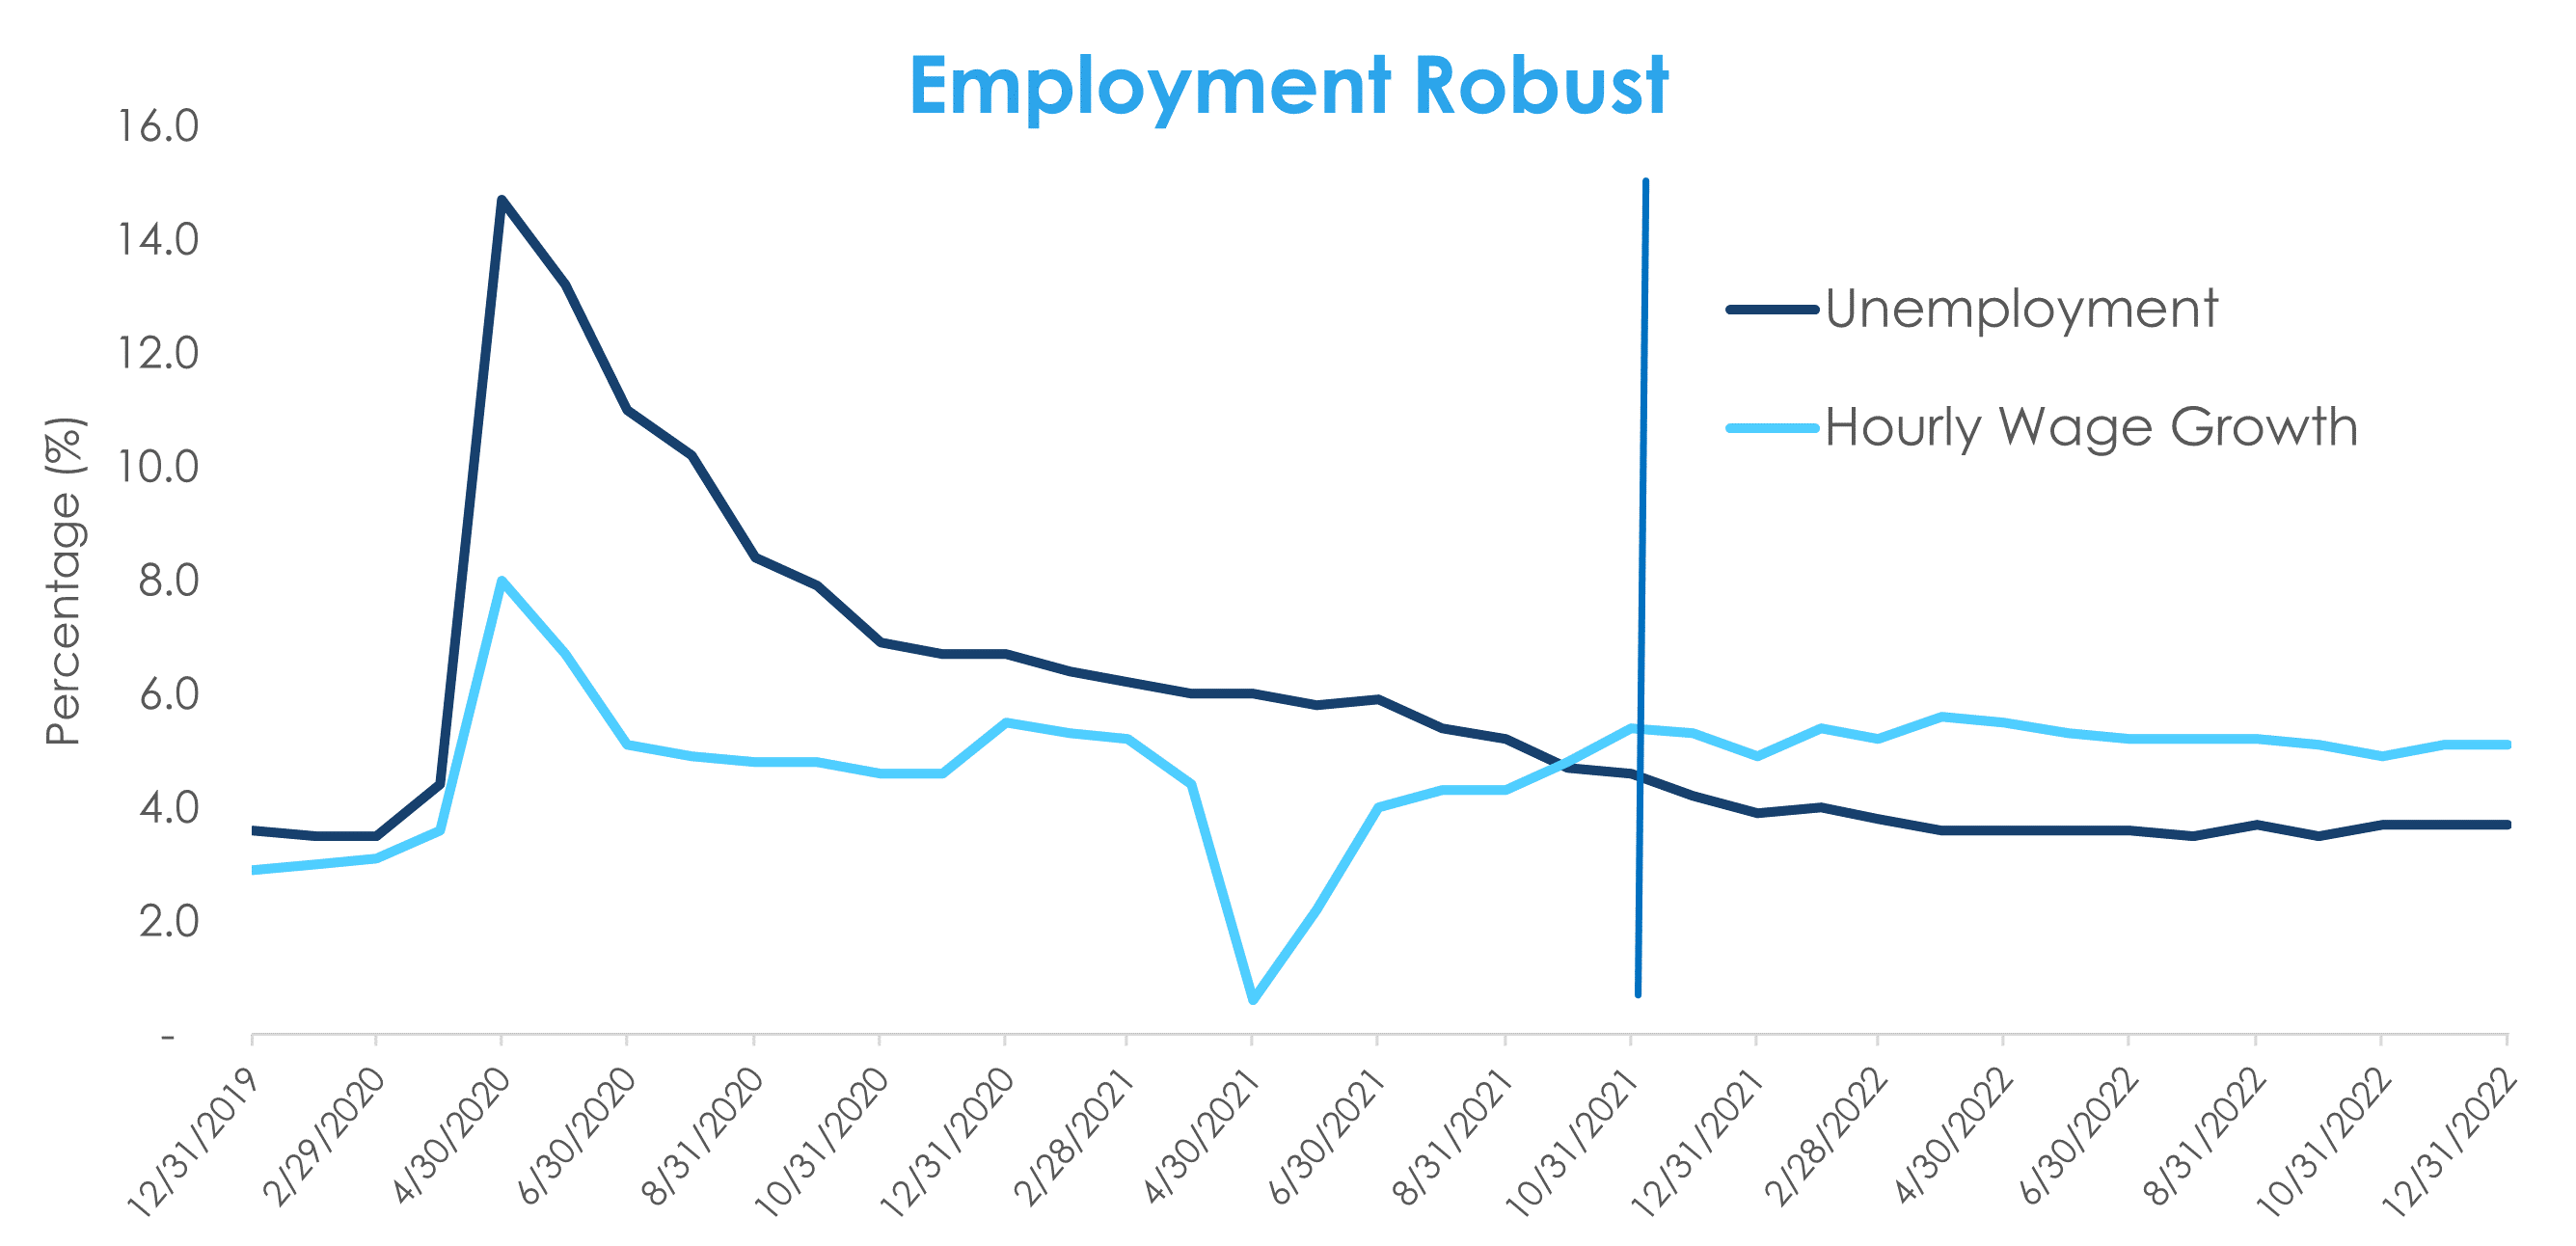
Chart 6: Oil prices hit over $120 per barrel in June, before finishing the year at $80. Average gasoline prices ended the year below $4.0 a gallon, providing some relief to consumers
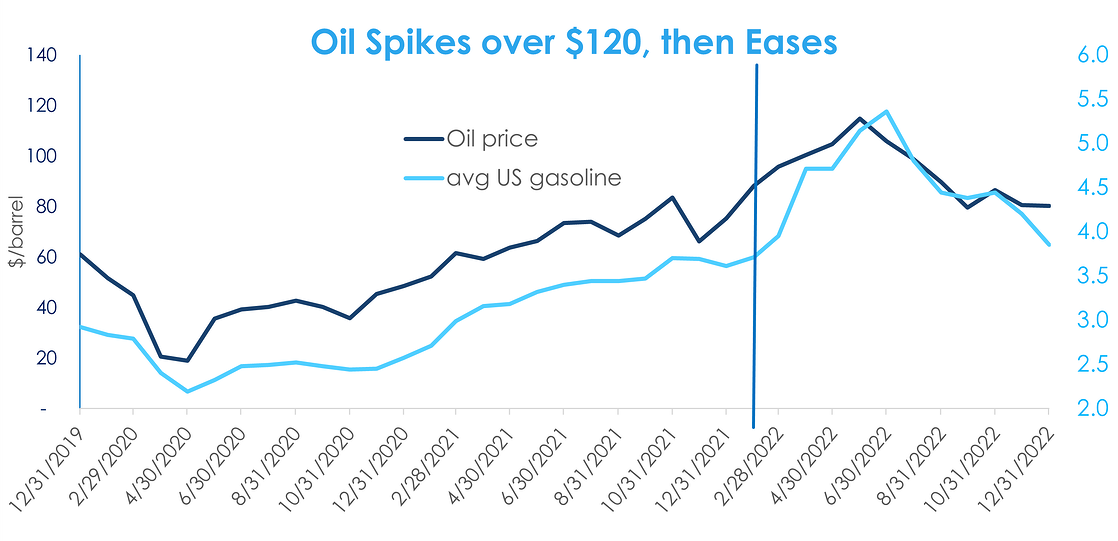
Chart 7: There was nowhere to hide in financial markets except cash, with double-digit negative returns for all major asset classes.
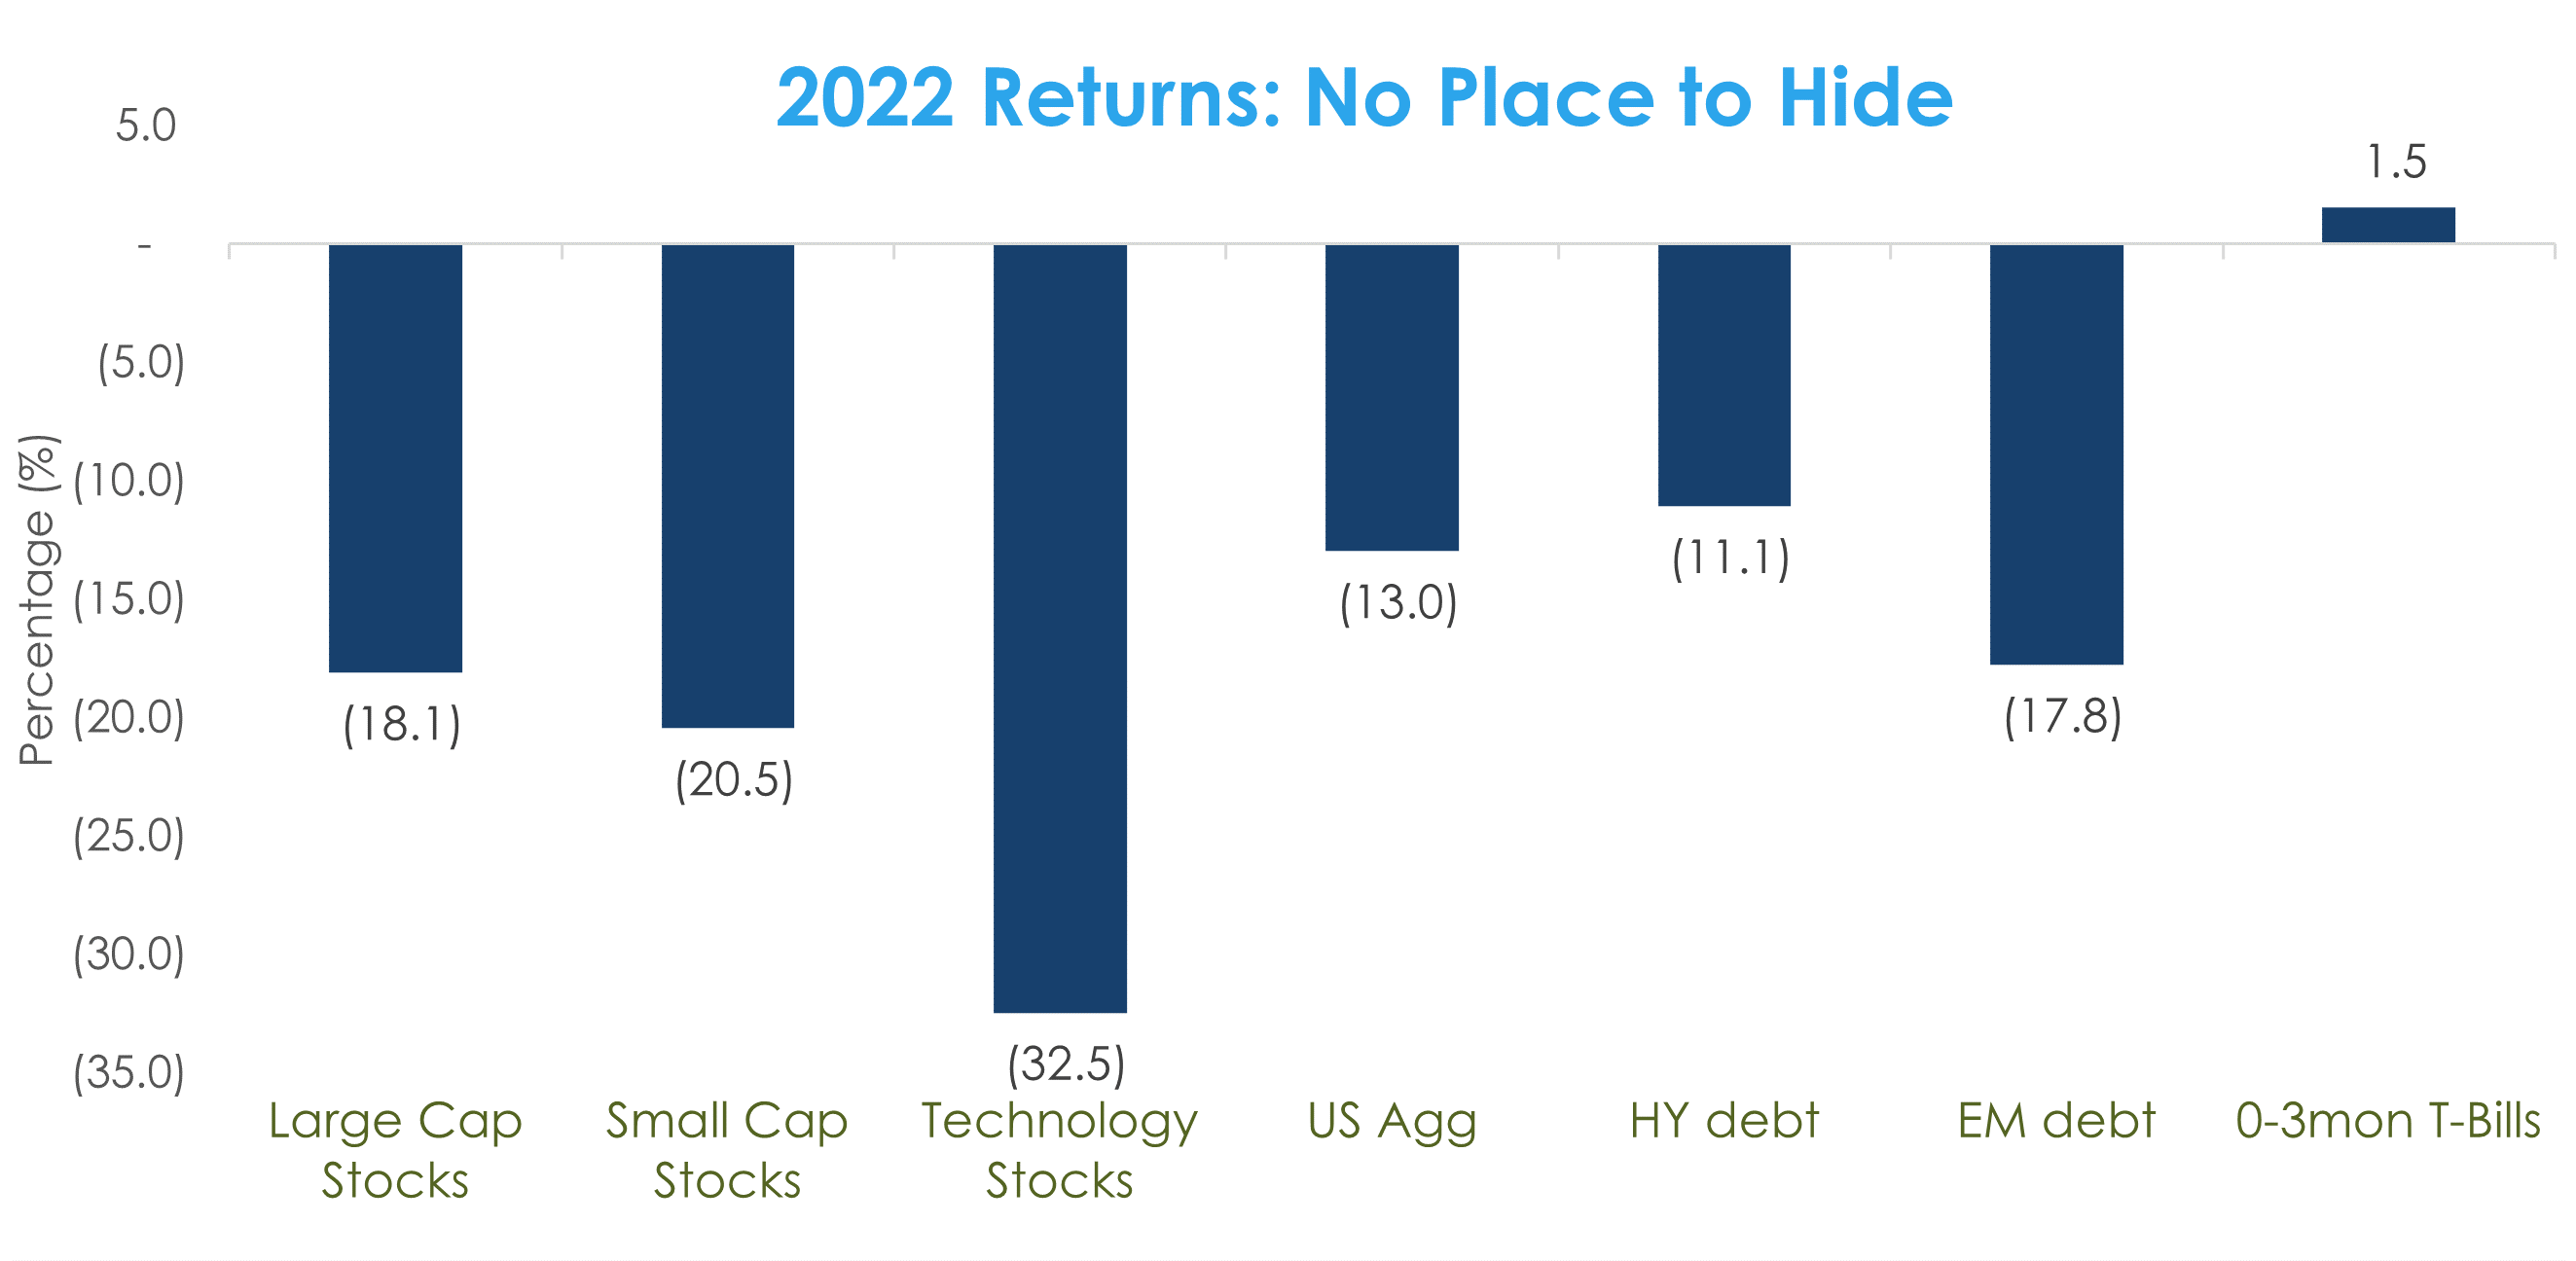
Chart 8: Returns turned positive in Q4 for stocks and bonds as investors began to look past the rate cycle.
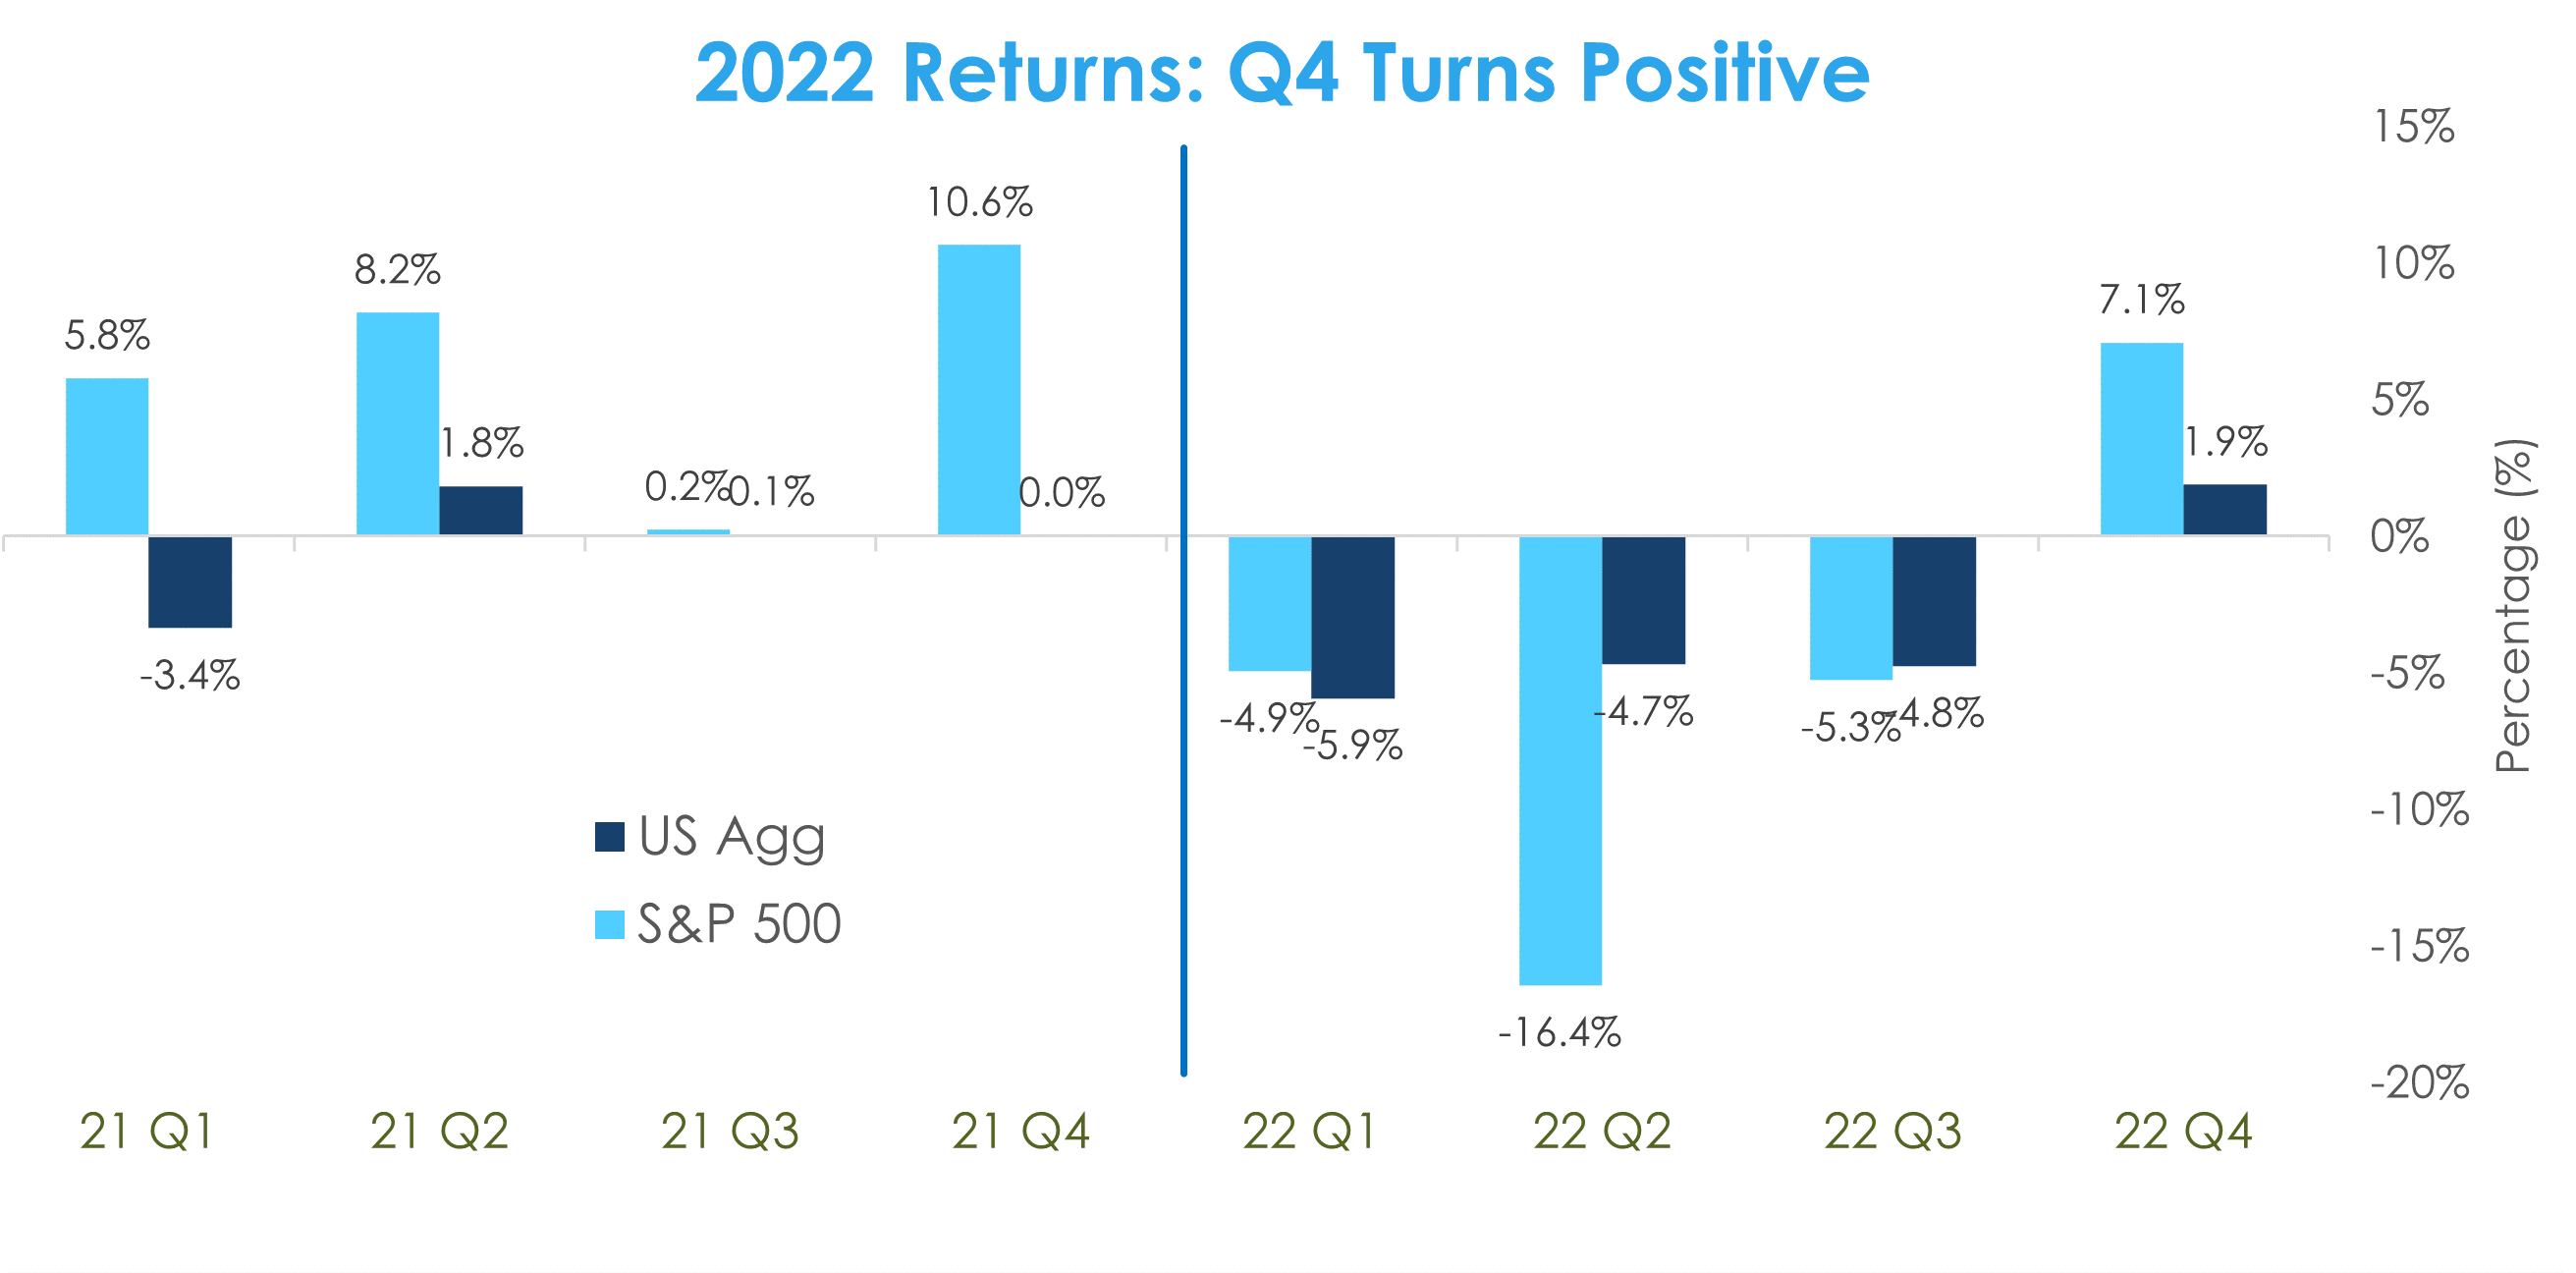
Chart 9: While bond market volatility spikes to above-Covid levels, equity volatility stays subdued.
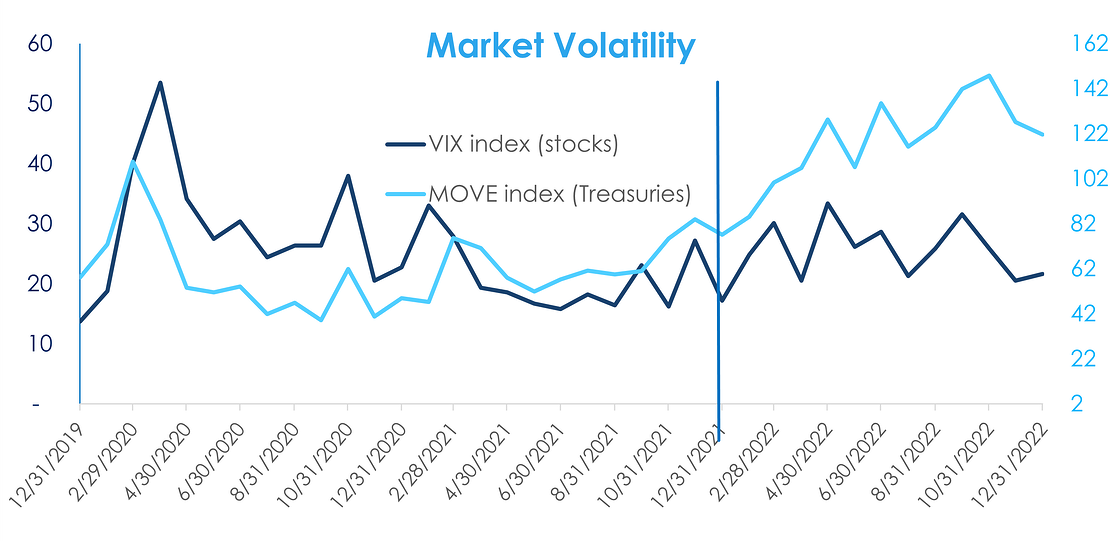
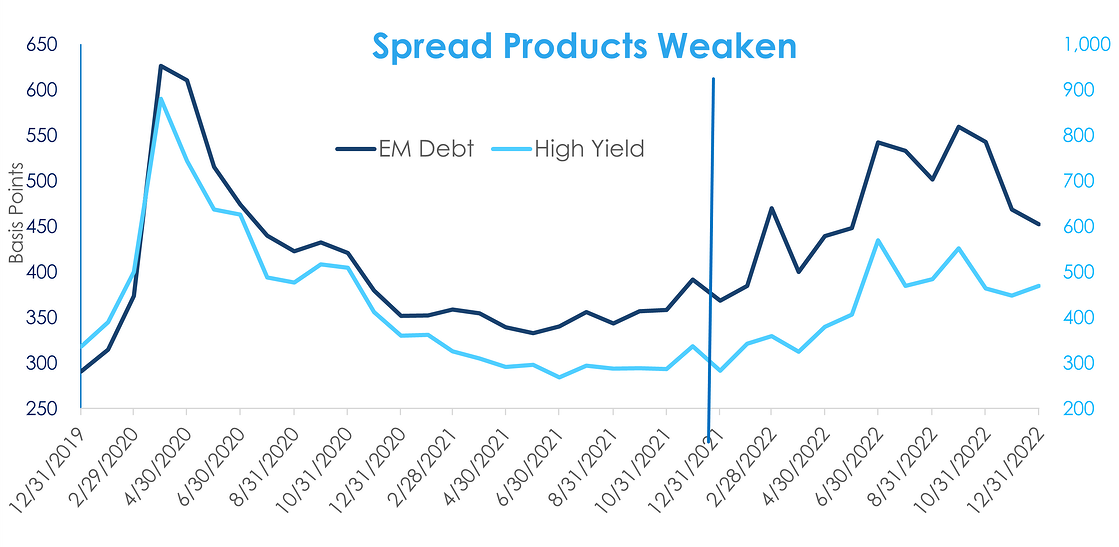
Chart 10: Not surprisingly, spreads widen amidst a restrictive Fed and looming recession, and stage a comeback in Q4, but do not signal doom and gloom.
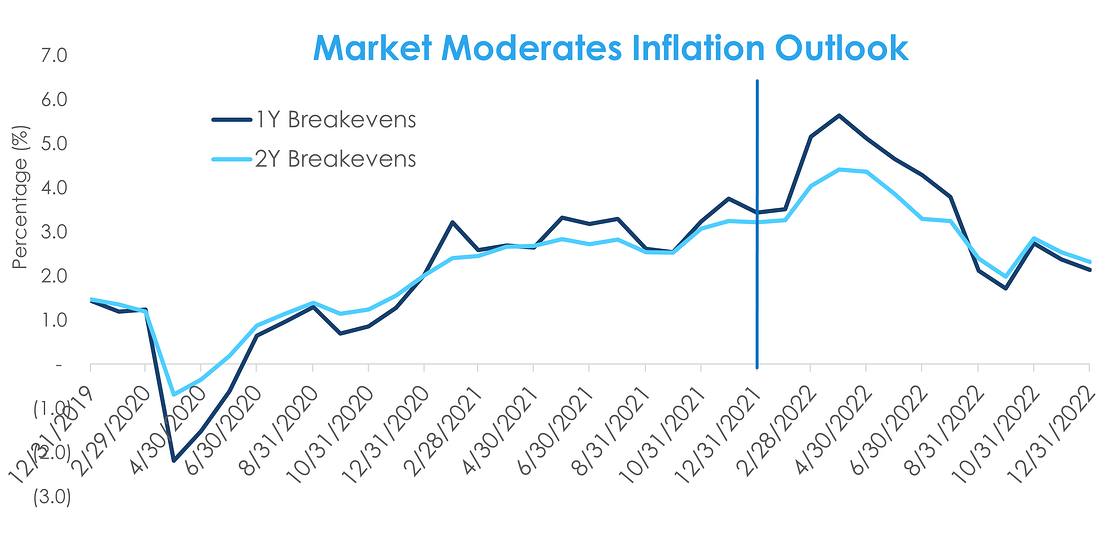
Bonus Chart A: As rate hikes started to impact reported numbers and the economic outlook, break-evens are now forecasting near 2% inflation by year-end.
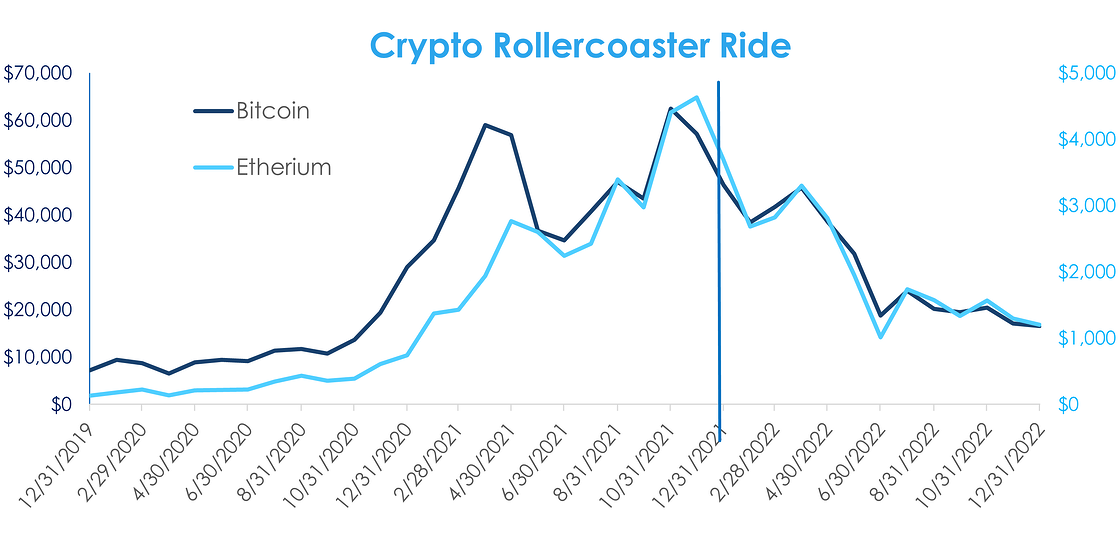
Bonus Chart B: Crypto provided a lot interesting headlines but fortunately did not result in contagion to the rest of the financial system.
Data Sources Include: BondBloxx, Bloomberg, JP Morgan, ICE Data Services, Bureau of Labor Statistics, Bureau of Economic Analysis, Federal Reserve, US Census Bureau, CBOE, National Association of Realtors, NYSE.
Originally published 10 January, 2023.
For more news, information, and analysis, visit the Institutional Income Strategies Channel.