
Companies understand the importance a strong brand in order to discern themselves from market competition within their respective sectors. In order to provide a visual representation of current brands that are undervalued in today’s global markets, Brandometry has created a new infographic chart, which should look familiar to most financial advisors and investment professionals.
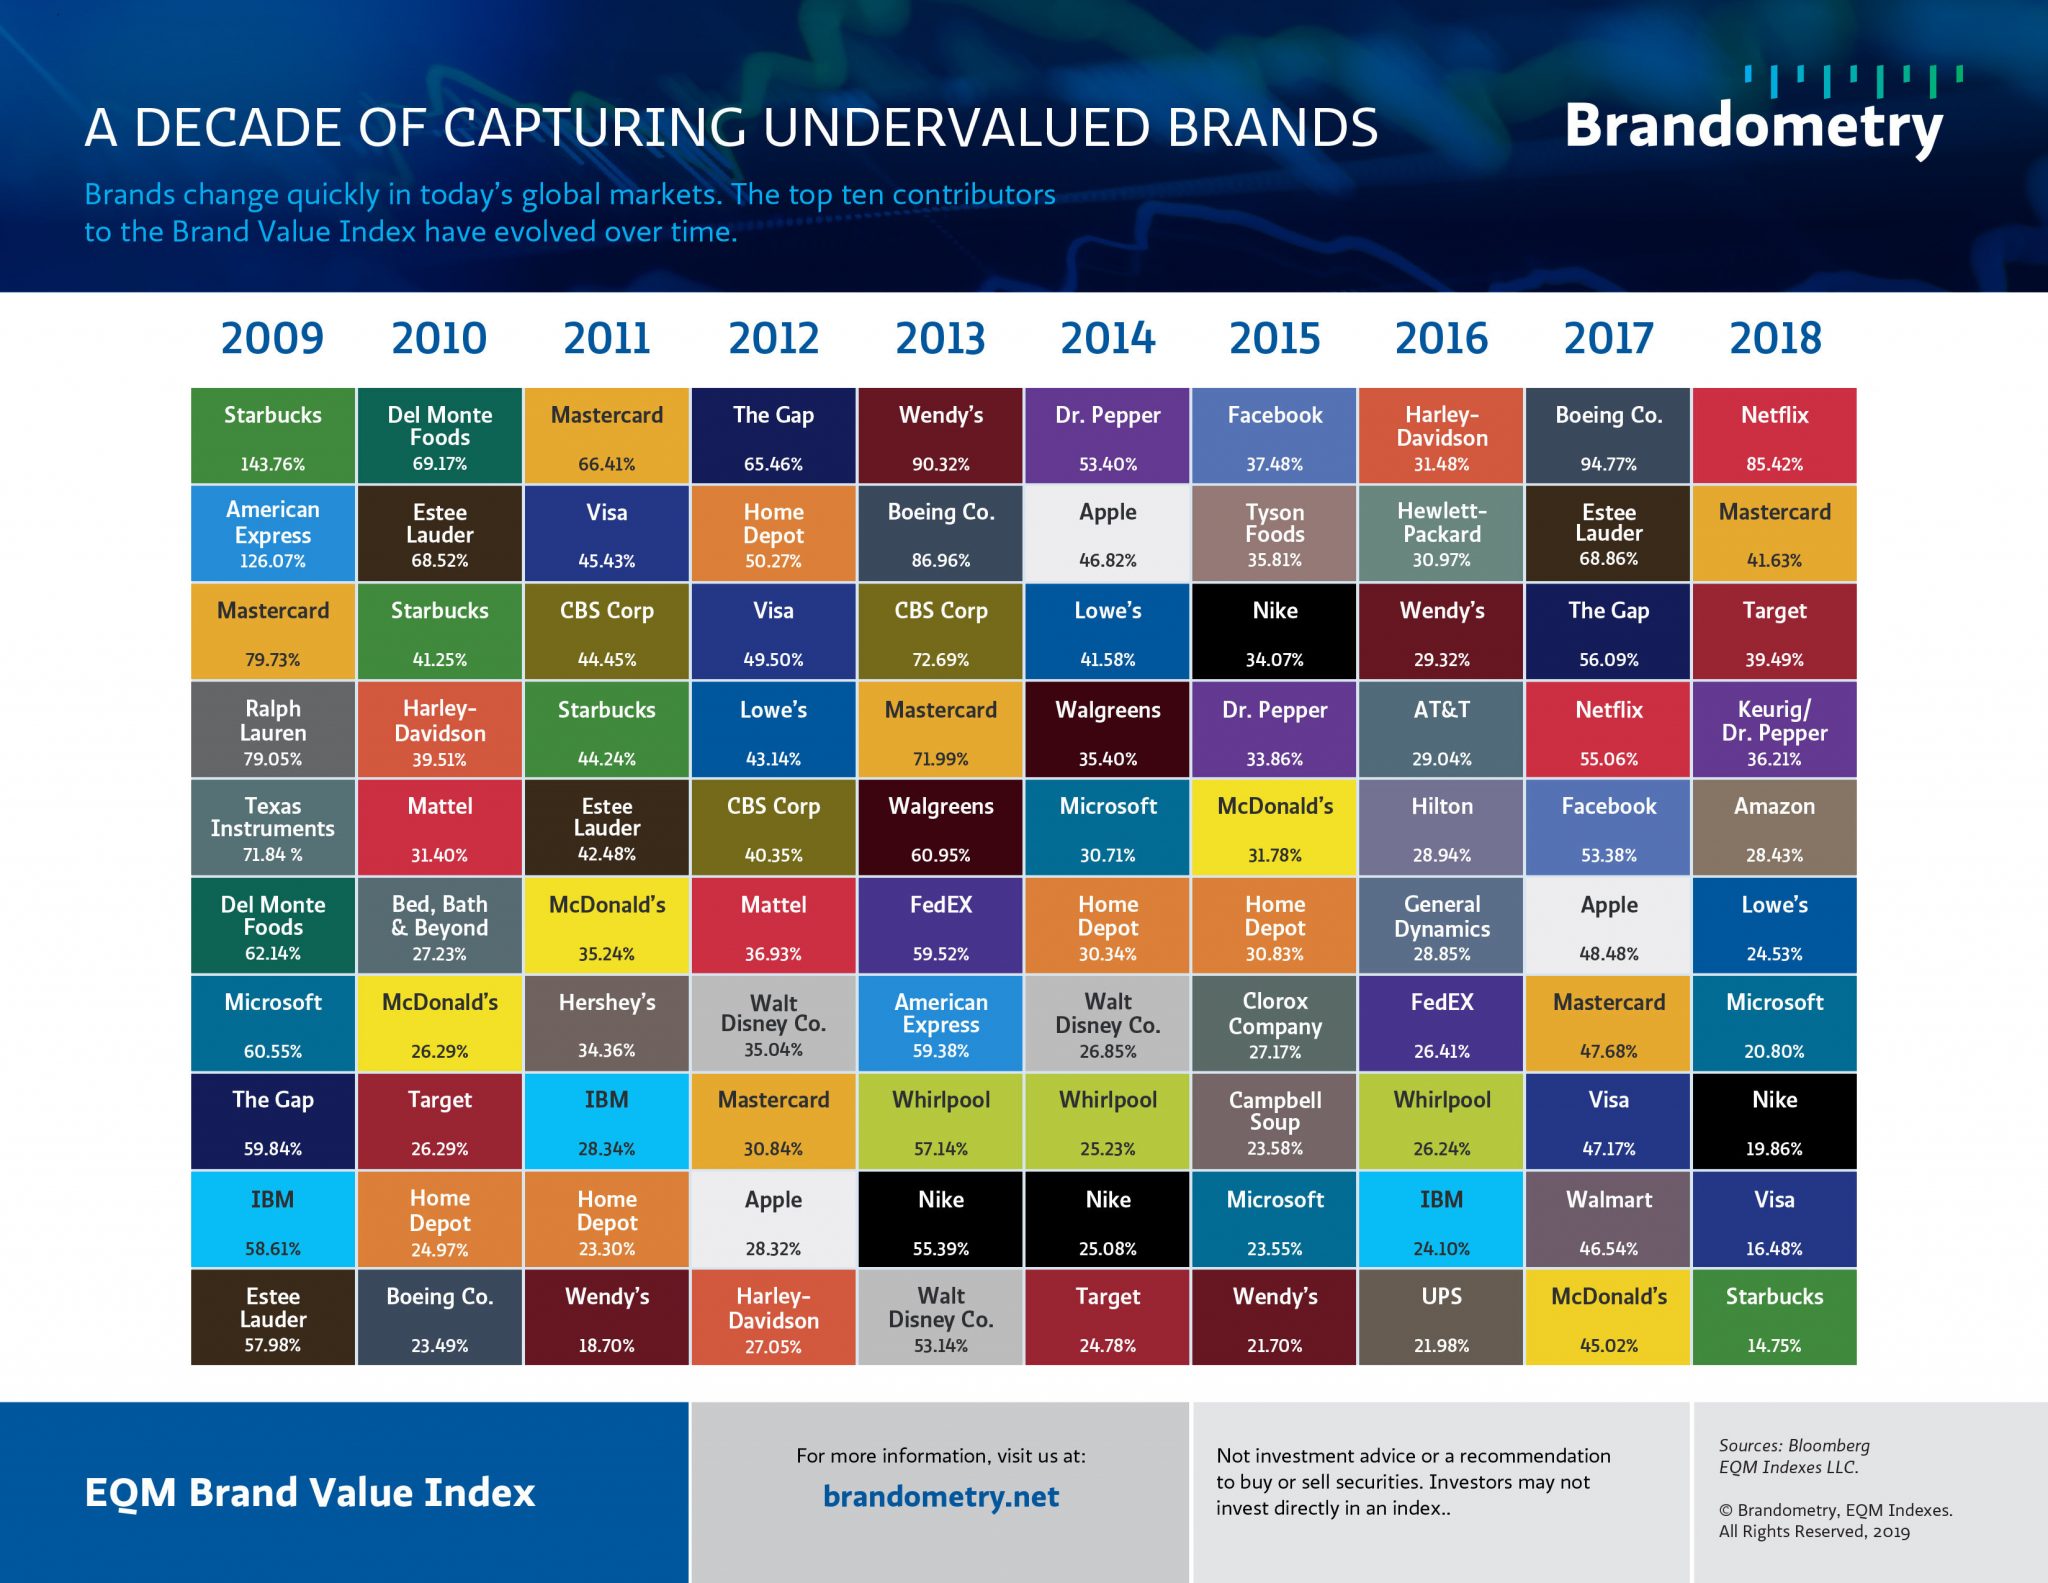
Similar to the famous quilt chart demonstrating the changing of the guards among asset classes each year, Brandometry’s chart depicts a similar rotation among undervalued strong brands tracked by the EQM Brand Value Index.
Each year, utilizing Tenet Partners’ proprietary Brand Power Score methodology, the Index selects the top 50 brands in terms of market timeliness and investment potential. Over the last decade, this approach has consistently beaten the market relative to the S&P 500 Index and most major U.S. indices.
The list of top ten brand performers varies each year, arguing for a diversified approach. In 2018, some of the top contributors of performance to the EQM Brand Value Index were Netflix, +85.42 percent, Mastercard, +41.63 percent, Target, +39.49 percent, and Keurig-Dr. Pepper, +36.21 percent–brand performance is for the time period held in the Index and not annual performance.
As Brandometry’s CEO Larry Medin explains, “While brand leadership varies each year, the Index has consistently identified the best brands to own and when to own them. The key is knowing when to own brands that are undervalued, and that’s what the Brand Value ETF strives to deliver for investors.”