

“I’m going to bet that the economy will be rebounding sometime this summer, if not sooner. We are in a slow patch. That’s all. It’s nothing to get up in arms about.” – February 5, 2008
When the facts change, I change my mind. What do you do, sir? – John Maynard Keynes
Inflation Might Continue to Underwhelm
While I’m certain Kudlow and Malpass could benefit from more than a little reflection and consideration on why their perspectives on the economy and markets have been so consistently misplaced, we ourselves are now considering the idea that inflation might continue to underwhelm and how that might affect our market outlook and investment posture going forward![]()
To be honest, our long-standing belief that nominal yields would continue to remain historically low over the long-term and across the transitional divide of the yield and growth supercycle – is more consistent with the current conundrum of relatively lackluster inflation and growth conditions, despite a mature economic expansion with historically low unemployment.
The idea that a late cycle pulse of inflation could surprise to the upside was in part derived from our expectations with the US dollar and real yields, which did in fact roll over from their respective cyclical highs.
![]()
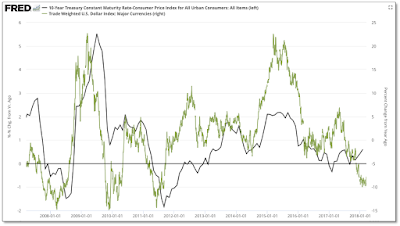
In short, we’ve speculated that the dollar breakdown could precipitate a downstream condition where the reach of inflation outstrips growth, creating a tailwind for hard assets like gold that typically gain in a declining real yield market environment. With strong consideration to the most recent inflation data and trends – both domestically and abroad, we’re open to the idea that inflationary pressures may have run their course – for now.
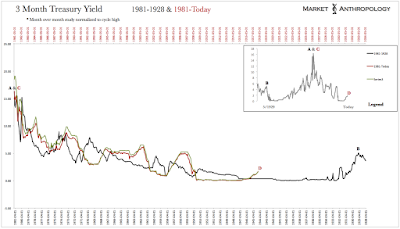
From a historic comparative perspective, we’ve viewed the current market environment against the template of the mid-1940’s, where a teflon equity market cycle greatly supported by the Fed and Treasury was eventually destabilized by less accommodative policy and surging inflation. Although it’s too early to determine which way – or under which economic and market conditions real yields trend over the next year, it’s worth reevaluating the 1937 analog that has been batted around by many over the past several years as a possible period to consider for prospective insights.
Besides the more typical parallels drawn between the two major post boom and bust periods (e.g. ZIRP and QE – see Ray Dalio’s comprehensive read from 2015), what’s interesting to note is when you look back at the mid 1930’s you find that real yields also moved lower – perhaps under the persuasion of a similar psychological boost – as the Fed began to tighten in the summer of 1936.
Real Yields Begin to Trend Higher
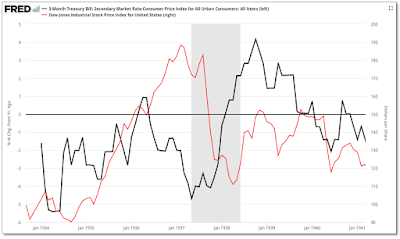
Following the second increase in reserves in March 1937, both short and long-term yields spiked. It wasn’t until the Fed tightened a third and final time in May 1937 that real yields began to trend higher, finally upsetting the ebullient swell in risky assets that had driven equities up 300 percent from the crisis lows of 1932.
Admittedly, I panned the comparison over the past several years, predominantly because I viewed the markets further out on the long-term yield trough, and where equity market valuations (as defined by CAPE) were also downstream and beneath the secondary highs in 2007.
In hindsight – and if history continues to resonate a certain cyclical pattern and rhythm, this perspective didn’t take into account the expanded proportions of the current long-term yield/growth cycle, that as I’ve described in past notes appears to influence a relatively proportional expansion of cyclical moves in CAPE.
For example, the previous long-term cycle (as measured trough to trough – annually) stretched 40 years, with estimates of a symmetrical retracement decline of the current cycle stretching over two times that span. Considering the fact that every long-term cycle has trended below the previous over the past several hundred years, it’s not a stretch to believe the current span could extend even greater than twofold as long.
Furthermore, the move in CAPE from its secular trough in 1982 – which also corresponded with the secular high in yields – to its secular peak in 2000, is 2.25 times the span of the previous cycle between 1921 and 1929. Applying this ratio to the span of the previous cycle between the secular valuation high in 1929 and the secondary high in 1937 (8×2.25), brings us to a secondary high in 2018 – as measured January 1st of each year.
Granted, there is always a real risk of attempting to solve a puzzle that may not exist or be deciphered; we predominantly apply this kind of long-term comparative reasoning as a orienting backdrop for contrast and color against current market conditions. At the end of the day we still strongly believe in the inherent behavioral nature that markets cyclically express themselves as, and typically find greater utility than folly in filtering our thoughts through the wide-angle prism of history.
Related: What Technical Indicators are Telling About 10 Year Treasury Yield
So, for what it’s worth… Despite our concerns with a shift higher in real yields, over the short-term we still expect gold to be under the dollar’s persuasion, which technically appears set for new lows. As we described in our note last month, we would be looking for a positive divergence in momentum from the US dollar index’s February low as suggestion that a more durable interim low is possibly in play.
Consequently We Are Looking for Gold Once Again
Consequently, we are looking for gold to once again test its cycle highs – as it has rallied to varying degrees several weeks out after each of the previous five rate hikes.
Should our concern that inflationary pressures are easing and that real yields have more room to move higher over an intermediate-term timeframe, we suspect gold to trade only marginally around the July 2016 highs, with likely greater volatility developing before a more lasting retracement decline would begin. In this respect, it wouldn’t surprise us to see gold trade in a widening range between 1400-1300 over the next several weeks.
That said, should these concerns be misplaced, we will be looking for gold to rally staunchly above the previous highs and not look back. Additionally, we would also like to again see silver begin to outperform gold, as it typically has under greater inflationary pressures.
Bullish on Long Term Treasuries
What’s interesting to note is that since the dollar’s breakdown over the past year, the silver:gold ratio has trended lower with the dollar, very much displaying the opposite dynamic of what was found between 2010 and 2011, where the dollar was plumbing the trough of its long-term range and silver cresting at a cyclical high. All things considered, we will be closing watching how precious metals behave over the next several weeks for greater intermarket insights.
Generally speaking, our newfound concerns with the direction of real yields and the markets perhaps more juvenile disposition within the long-term yield trough, does not greatly influence our relative performance expectations across most markets. It predominantly impacts our absolute performance outlooks within an intermediate-term timeframe, specifically with respect towards gold and the US dollar.
We see no reason to become more bullish on equities here and still believe the parabolic breakdown will be respected, with lower lows and lower highs throughout this year. If anything, we’re leaning more bearish on an absolute performance basis towards equities – more bullish on long-term Treasuries, and still believe gold will strongly outperform equities across both intermediate and long-term timeframes.
This article has been republished with permission from Market Anthropology.