

![]()
So it isn’t just full year periods where we see positive returns, but this data demonstrates that we have also historically seen positive returns in the months during which interest rates are increasing and the months after those increases have occurred.
As we have noted in some of our recent writings, this historical performance does makes sense given the high yield bond market’s lower duration and the fact that high yield performance seems to be much more tied to credit quality and default rates. We generally see rates rising in the face of economic strength— which also happens to be the premise for the current argument for rates to go higher—and economic strength generally leads to stable and/or low default rates, benefiting high yield bonds. For more on how the high yield market has historically performed during periods of rising rates and various investment strategies in the face of potentially higher rates, see our recent piece “Strategies for Investing in a Rising Rate Environment.”
(1) 2-year, 5-year, and 10-year US Treasury yield for the period 4/25/17 to 4/25/18. Data sourced from the U.S Treasury Department, https://www.treasury.gov/resource-center/data-chart-center/interest-rates/Pages/TextView.aspx?data=yield.
(2) Bloomberg Barclays Capital U.S. High Yield Index covers the universe of fixed rate, non-investment grade debt (source Barclays Capital). Bloomberg Barclays US Corporate Investment Grade Index consists of publicly issued U.S. corporate and specified foreign debentures and secured notes that meet the specified maturity, liquidity, and the quality requirements (source Barclays Capital). Covers annual, calendar year returns from January 1986 to December 2017. 5-yr Treasury data, 2008-2012 sourced from Bloomberg (US Generic Govt 5 Yr), 2013-2017 data from the Federal Reserve website.
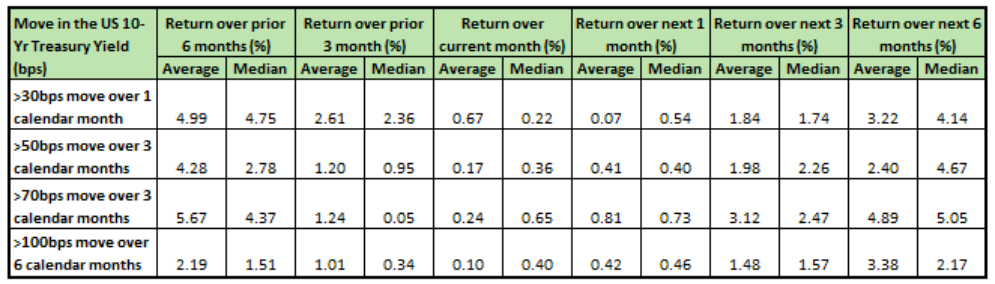
(3) Data analyzing the month end levels of the 10-yr US Treasury yield versus the monthly returns for the Bloomberg Barclays High Yield Index, looking specifically at performance for the High Yield Index during periods when the 10-year yield moved above the noted thresholds from one month end to another. Intra-month data was not analyzed. Trailing performance numbers are for the prior 6 months and 3 months before the month end in which we saw the Treasury yield cross the threshold, for the current month in which is crossed threshold and for the one, three, and six month periods after the calendar month in which Treasury yields cross the threshold. Bloomberg Barclays Capital U.S. High Yield Index covers the universe of fixed rate, noninvestment grade debt. Data sourced from Barclays and Bloomberg and covers the period of 12/31/1986 to 12/31/2017.
Although information and analysis contained herein has been obtained from sources Peritus I Asset Management, LLC believes to be reliable, its accuracy and completeness cannot be guaranteed. This report is for informational purposes only. Any recommendation made in this report may not be suitable for all investors. As with all investments, investing in high yield corporate bonds and loans and other fixed income, equity, and fund securities involves various risks and uncertainties, as well as the potential for loss. High yield bonds are lower rated bonds and involve a greater degree of risk versus investment grade bonds in return for the higher yield potential. As such, securities rated below investment grade generally entail greater credit, market, issuer, and liquidity risk than investment grade securities. Interest rate risk may also occur when interest rates rise. Past performance is not an indication or guarantee of future results. The index returns and other statistics are provided for purposes of comparison and information, however an investment cannot be made in an index.