
History shows inverted yield curves presages a recession
The news is abuzz with the revelation that the Treasury bond markets are showing signs of an inverted yield curve. An inverted yield curve is when short-term interest rates become higher than long-term interest rates.
The yield curve is normal when short term treasury bonds have lower yields than long-term Treasuries. The indicator makes sense since investors should expect a higher rate of return for tying up their money for a longer period. So why would short term yields be higher? It is commonly believed that an inverted yield curve is a sign that a recession is on its way. If we take a look at this chart from JPMorgan Asset Management:
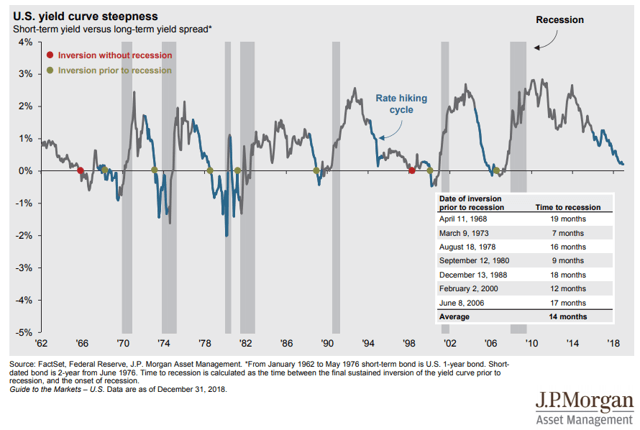
We can see that recessions often follow an inverted yield curve by a lag of about 14 months. For instance, in April 2000, the inverted yield curve during the height of the tech boom only to have the market collapse a year later. The curve means that investors should have an adequate amount of time to prepare for an end to the 10-year bull market.
Many market observers believe that the current inverted yield is due to global economic factors like concerns over Brexit, China, and the possibility that the Fed will raise interest rates. This supposed level of uncertainty could result in misreadings in the market forecast. Nevertheless, if history is any indicator, there is more than a likely possibility that a recession is in our future.
There are already indicators that earnings will be decreasing this year with renewed calls for the fed to lower interest rates to spur economic growth. Observers will be paying close attention to other economic indicators such as GDP growth, unemployment, and inflation to obtain a clearer picture of what is in store for the market.
For more market trends, visit ETF Trends