

By Confluence Asset Management
The Federal Reserve published its Financial Accounts of the United States report last week, more commonly called the “Flow of Funds” data. The report offers a plethora of insights into the economy. This week we want to examine the household debt situation.
In Q1, household debt reached $15.1 trillion, up 3.4% from the previous year.
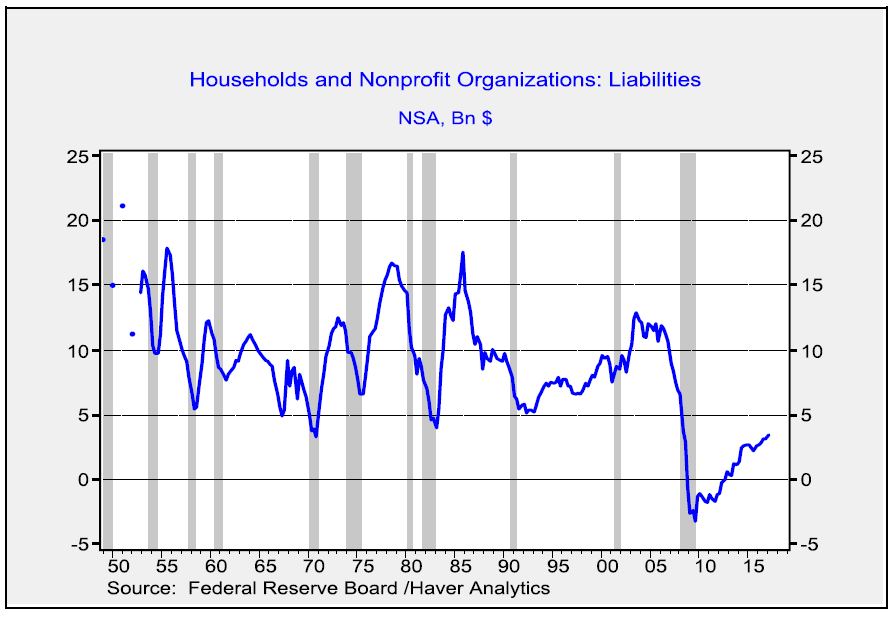
Although the growth in liabilities is positive for consumption, note that the current growth rate is well below the 9.8% average from 1946 through 2006. As we will show below, deleveraging continues but the pace has slowed dramatically. Still, part of the reason for sluggish growth is that households are simply not borrowing as quickly as what we have seen in the postwar period.
As noted, deleveraging has continued but the pace has slowed to a crawl.
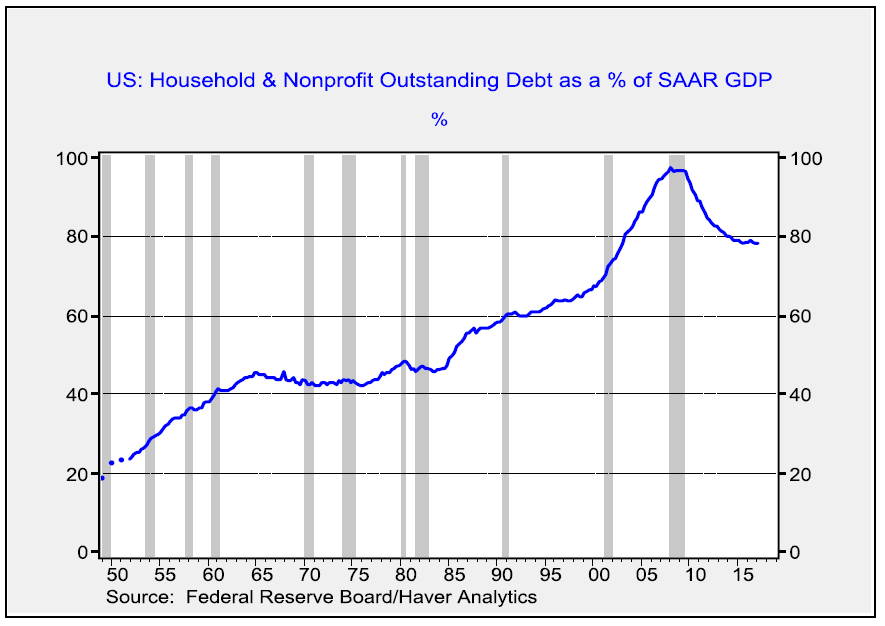
Household debt (non-profit debt is not meaningful) is down to 78.2% of GDP after peaking at 97.7%. It is virtually impossible to determine the “correct” or sustainable level of debt, but a solid case can be made that any reading above 60% is probably not manageable over the long run. Of course, there are three ways this ratio can decline, falling levels of debt, rising real GDP relative to debt or rising inflation relative to debt. The lack of inflation has probably prevented an even larger drop in this ratio.