

We will build six portfolios representing six different risk levels. Each portfolio will strive to have the same expected maximum drawdown[2] as its corresponding stock/bond mix. For example, for our “0/100” portfolio, we will seek to maximize expected return subject to our expected maximum drawdown being less than that of the 0/100 portfolio.
Specifically, for a given target stock/bond mix:
- Use our expected returns, volatilities, and correlations and simulate out 10-years of hypothetical returns for our assets.
- Using those simulated returns, compute sample annualized returns and covariances.
- Compute expected maximum drawdown of the target stock/bond mix using the sample annualized returns and covariances.
- Compute the portfolio that maximizes expected return, given our sample annualized returns and covariances, subject to,
- Having an expected drawdown less than or equal to the expected drawdown calculated in step #3.
- The weight of stocks and bonds must sum to 100%.
- No shorting and no positions exceeding 100%.
- The sum of all long/short positions can only equal the size of the stock position so that the net stock exposure is purely the long factor indices in the most extreme case.
Results
As we mentioned above, the choice of defining our long/short factors as long-only indices minus market returns allows us to aggregate results. In these results below, we’ve long/shorts and turned them into long-only exposures by reducing an equivalent amount of passive equity exposure.
Without further ado…
| 0/100 | 20/80 | 40/60 | 60/40 | 80/20 | 100/0 | |
| Total Bond | 78.9% | 78.7% | 60.0% | 37.9% | 19.3% | 9.8% |
| Total Equity | 21.1% | 21.3% | 40.0% | 62.1% | 80.7% | 90.2% |
| Value | 4.3% | 4.5% | 7.7% | 12.0% | 22.2% | 25.5% |
| Quality | 5.1% | 5.7% | 8.3% | 13.5% | 13.5% | 12.1% |
| Size | 0.1% | 0.2% | 0.5% | 0.5% | 3.3% | 7.3% |
| Momentum | 9.1% | 8.7% | 19.1% | 27.6% | 29.4% | 24.2% |
| Low Volatility | 1.7% | 1.4% | 3.3% | 4.7% | 4.1% | 1.8% |
| Passive Equity | 0.7% | 0.6% | 1.0% | 3.7% | 8.2% | 19.3% |
Data: MSCI, CSI, J.P. Morgan, Kenneth French. Calculations by Newfound Research.
What do we see?
- Both the 0/100 and 20/80 models have similar bond positions. This is due to the fact that 0/100 and 20/80 stock/bond portfolios have very similar expected max drawdowns. This arises from the fact that the two portfolios have similar volatility levels (the benefits of diversification!) while the introduction of equities increases the expected return in the latter.
- From the 20/80 to the 80/20, bonds stay in line with the strategic model. Despite the fact that the long/shorts introduce significant volatility on their own, they are diversified enough from both the strategic assets, as well as one another, that a step-up in bond exposure is not necessary.
- That is, until the 100/0 profile. In the pursuit of maximizing returns, Value and Momentum are given significant relative overweights compared to the other factors. While these are the two factors that had the greatest diversification from one another, the residual risk they add to the portfolio required the introduction of bonds. The interesting takeaway is that the optimizer believes that a multi-factor 90/10 can actually outperform a passive 100/0 on an absolute basis while maintaining the same risk profile.
- Also interesting to note is that in the 80/20 and 100/0 profiles, there is a significant residual exposure to Passive Equities (meaning equity exposure with no factor tilt). Diversification between passive and active equity strategies is just another form of the strategy diversification that we are trying to achieve by using a multi-factor approach.
- Momentum is, by far and away, the “premier anomaly.” Despite having the highest transaction costs, it is the largest factor allocation in each of the risk profiles.
- Low Volatility plays a very small role. In less risky portfolios – where people typically advocate for Low Volatility approaches – Quality and Value are used to offset the increased risk introduced by Momentum.
- In more aggressive portfolios, Value and Momentum appear to be the best pairing, though Low Volatility and Quality remain involved as potential hedges.
- Size plays little-to-no role throughout. This does not come as much of a surprise, given the assault on the legitimacy of this premium in the last several years. That said, the results could have been meaningfully different had we taken a Size/Value or Size/Quality tilt, which still appears robust.
We cannot stress enough that these results are highly dependent upon the inputs. In this case, we are explicitly making the assumption that past returns are indicative of future returns for the factors (this is a common assumption with factor research). While we believe our simulation-based approach can help account for a degree of estimation error in the inputs, garbage in will still lead to garbage out. If you fundamentally disagree with our return assumptions, then you should fundamentally disagree with our results.
No Premium, No Allocation?
As factor premia are a hotly debated topic, let’s also ask the following question: if we assume zero associated premium, would we bother allocating to factors at all?
To answer this question, we re-compute the expected factor returns as simply the residual beta times the expected excess return for equities minus implementation costs. This means a factor like Low Volatility still has a negative expected return – as the long/short still has a beta of -0.3 – but now so does Momentum, since it has a near-zero beta but high associated implementation costs.
| Expected Return | Volatility | |
| Bond | 1.06% | 3.50% |
| Equity | 5.25% | 14.75% |
| Value | 0.45% | 6.54% |
| Quality | -0.65% | 5.53% |
| Size | 0.02% | 3.39% |
| Momentum | -0.63% | 7.69% |
| Low Volatility | -1.68% | 6.86% |
Assuming zero associated premium, would we still allocate? The answer is a resounding, “yes.”
| 0/100 | 20/80 | 40/60 | 60/40 | 80/20 | 100/0 | |
| Total Bond | 81.4% | 80.5% | 63.7% | 41.4% | 23.8% | 13.8% |
| Total Equity | 18.6% | 19.5% | 36.3% | 58.6% | 76.2% | 86.2% |
| Value | 5.0% | 5.6% | 9.4% | 14.7% | 20.9% | 31.0% |
| Quality | 3.6% | 4.1% | 6.2% | 10.3% | 10.5% | 7.6% |
| Size | 0.9% | 0.9% | 2.5% | 5.1% | 5.5% | 7.0% |
| Momentum | 4.5% | 3.7% | 7.7% | 12.6% | 15.8% | 17.9% |
| Low Volatility | 2.1% | 2.2% | 4.2% | 7.0% | 7.8% | 4.4% |
| Passive Equity | 2.5% | 3.0% | 6.2% | 8.9% | 15.8% | 18.3% |
We see many of the same trends. However, now that Momentum has a negative expected return, it’s relative proportional share of the factor portfolio is reduced. However, given its beneficial diversification properties with respect to Passive Equity and Value, it still remains a large piece of more aggressive portfolios. Similarly, we see a reduction in the allocation towards Quality.
Assuming zero excess strategy premiums, it appears that Value reigns king due to its low slight positive market beta, low correlation to equities and bonds, and significantly lower implementation costs than other strategies.
Conclusion
We find in this exercise that the mix of factors employed in a portfolio should vary depending on investor objective and assumptions about forward factor returns. If we assume forward premia are likely to be similar to those realized in the past, more risk-averse investors may benefit from a 50/25/25 tilt split towards Momentum/Value/Quality, while a more aggressive investor may prefer a 40/40/20 split of Momentum/Value/Quality.
We can see that these splits are fairly constant by isolating just the recommended relative factor exposure.
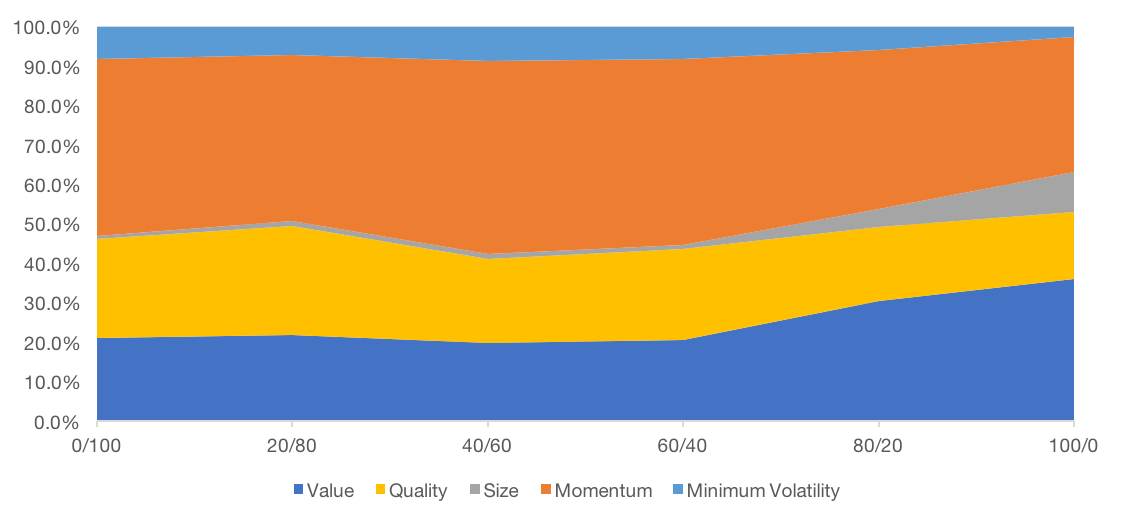
Data: MSCI, CSI, J.P. Morgan, Kenneth French. Calculations by Newfound Research.
Based upon this data, it would appear that the answer to our original question is “no”: we should not use the same mix across our risk spectrum. At higher risk levels, we should move towards an even split of Value and Momentum while at lower risk levels we should use Quality as a risk hedge.
On the other hand, the relative proportional changes are not so drastic that, based upon this data, we could likely just use a 50/25/25 Momentum/Value/Quality split across the entire spectrum and not end up being far from optimal ex-post.
Perhaps the most interesting takeaway is in the extreme portfolios: active risk from factors may allow us to take more risk in our 0/100, but force us to take less risk in our 100/0. It seems active risk can cut both ways.
[1] Frazzini, Andrea and Israel, Ronen and Moskowitz, Tobias J., Trading Costs of Asset Pricing Anomalies (December 5, 2012). Fama-Miller Working Paper; Chicago Booth Research Paper No. 14-05. Available at SSRN: https://ssrn.com/abstract=2294498
[2] See http://alumnus.caltech.edu/~amir/mdd-risk.pdf