

By Richard Bernstein, Richard Bernstein Advisors
Introductory economics classes discuss monetary policy’s inconsistent lead times. Many observers have described monetary policy as a blunt tool with which to steer the economy because of the unpredictability of both the timing and magnitude of effects associated with the easing or tightening of monetary policy.
A primary cause for that unpredictability is that the Federal Reserve cannot force banks to lend or not lend. The Fed might prefer a certain monetary policy track, but there is no guarantee that the private sector banking system will abide by the Fed’s desires.
At the trough of a cycle, banks perceive lending to be so risky that their risk aversion can overwhelm the Fed’s desire for the banks to increase lending. That in turn forces the Fed to further ease monetary policy. Such risk aversion was so prevalent during the last recession that even 0% interest rates did not spur lending. We coined the phrase at that time, “you can lead a horse to water, but you can’t make it lend”.
At the peak of a cycle, however, banks’ lending profits can be so large that the thirst to lend more overwhelms the Fed’s desire for the banks to calm down. That in turn forces the Fed to further tighten policy. In most cycles, the Fed eventually tightens too much, and a recession subsequently occurs.
Chart 1 shows the total assets of the S&P 1500® Supercomposite Bank Index. Bank assets grew at a rapid pace in 2006/7 despite lending risk increasing significantly and the Fed raising rates. Bank assets then fell precipitously after 2008’s recession and it took years for banks to again expand their balance sheets. There are, of course, many reasons why bank balance sheets might change in size other than monetary policy. One should also examine accounting changes, regulatory changes, and the like. Nonetheless, bank balance sheets during the past 20 years reflect the long-standing problems associated with the lags associated with monetary policy.
CHART 1:
S&P 1500® Supercomposite Banks Index: Total Assets
(Mar. 2002 – Jan. 2019)
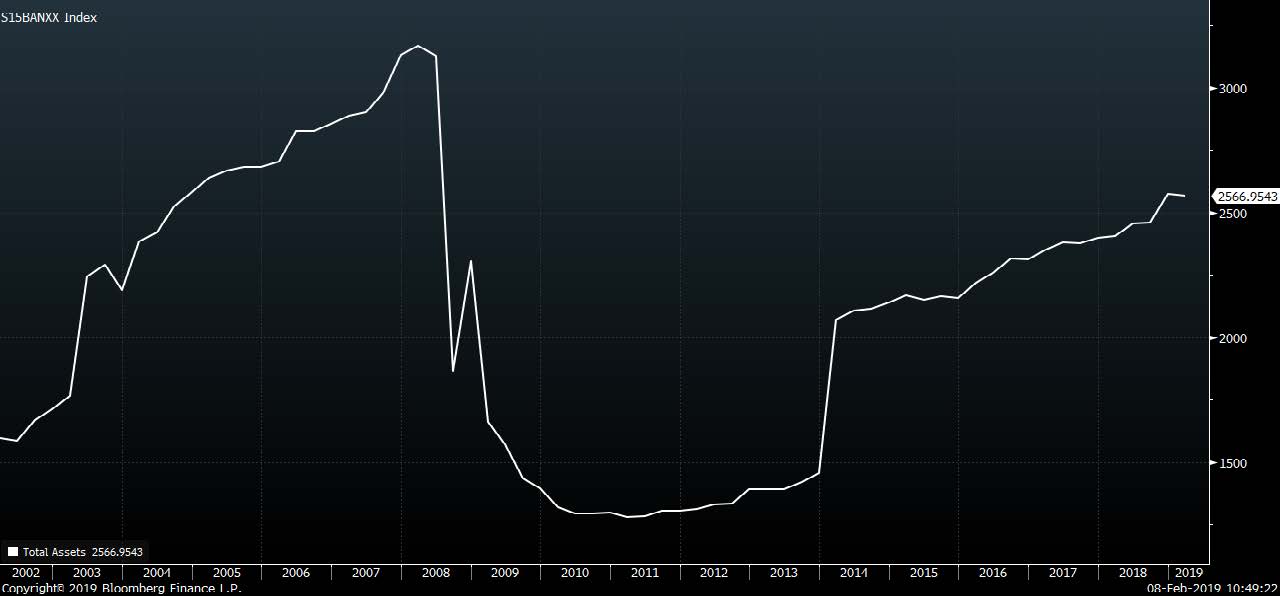
Source: Bloomberg Finance L.P. For Index descriptors, see “Index Descriptions” at end of document.
Once again, this cycle is more normal than investors believe The current economic cycle remains remarkably normal despite claims that the cycle is unique or unprecedented. Similarly, the relationship between the Fed’s desire to set monetary policy and the banks’ business decisions have been somewhat out of step. As in previous cycles, the Fed raised rates before banks began to tighten credit.
Chart 2 shows the Fed’s target rate for Fed Funds, and the Fed started raising rates (i.e., tightening policy) in December 2015. However, Charts 3-5 highlight that banks have only recently begun to tighten credit policies. These charts come from the Fed’s Senior Loan Officer Opinion Survey, and rising lines suggest a tightening of credit conditions. In some cases, such as Commercial and Industrial (C&I) Loans, banks were easing credit conditions during 2016 and 2017 despite that the Fed was tightening monetary policy.
The Fed has recently seemed squeamish about continuing to tighten monetary policy considering increased equity market volatility. However, the Fed’s survey of loan officers suggests that loan officers are tightening lending standards. Should this trend continue, banks would seem to be moving in the opposite direction of the Fed.
CHART 2:
Fed Funds Target Rate
(Jan. 1999 – Jan. 2019)

Source: Bloomberg Finance L.P.
CHART 3:
Credit Standards: C&I* Loans to Large & Medium Firms
(Jan. 1997 – Jan. 2019)

Source: Richard Bernstein Advisors LLC. FRB. *Commercial and Industrial. For Index descriptors, see “Index Descriptions” at end of document.
CHART 4:
Credit Standards: Consumer Credit Card Loans
(Jan. 1997 – Jan. 2019)
