

By Sean Clark, CFA®, Chief Investment Officer, Clark Capital Management Group
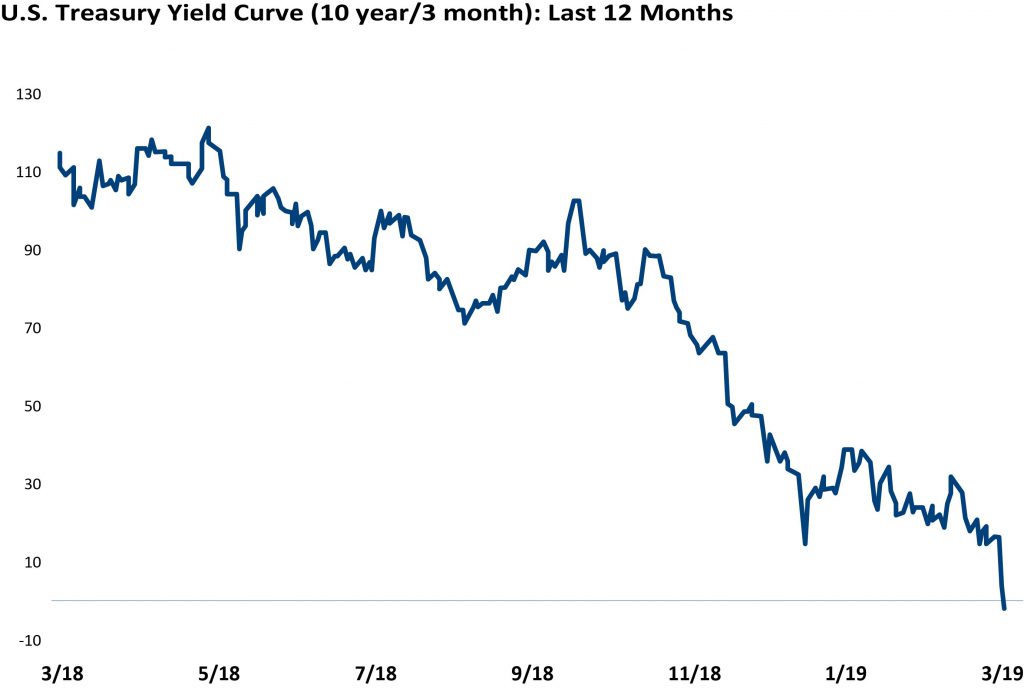
On Friday of last week, the yield curve finally inverted ever so slightly, by just 1 basis point, as the 3-month Treasury bill yield rose above the yield for 10-year Treasury note. It was the first inversion of this measure of the yield curve since 2007—the longest stretch on record without an inverted curve since at least 1962.
The yield curve has been flattening for several years, but it has recently accelerated into negative territory as the Fed’s about-face and more dovish tone lowered economic expectations. This, combined with weakening data overseas, caused a tsunami of Treasury bond purchases. The below chart from Bespoke Investments shows the path to inversion over the past twelve months.
Now that the Treasury yield curve has inverted, calls for a recession have increased as every recession since 1962 has been preceded by an inversion. However, we are not making a recession call at this time, as we believe recession calls are very premature. As of this morning’s commentary, the curve is already back into positive territory. A one-day inversion doesn’t mean much by itself without other evidence confirming.
The economy has been incredibly resilient during this expansion, and we ended 2018 with 3.1% real GDP, the strongest calendar year GDP since 2005. In addition, the credit quality yield spread between high yield bonds and Treasury bonds continued to narrow from a recent peak of 537 basis points in January to 380 basis points on Thursday. We would expect high yield spreads to widen considerably, reflecting economic angst in the credit market well in advance of recession. That does not appear evident at this time.
Even though every recession since 1962 has been preceded by an inversion, not every inversion has been followed by a recession. We look at a lot of data regarding the economy, but there are three indicators that we focus in on, which give plenty of warnings prior to recessions. These indicators are the Conference Board’s Index of Leading Economic Indicators, the health of the labor market, and the yield curve.
Of these three, only the yield curve has flashed a warning by inverting, but let’s put this into context. The Federal Reserve of San Francisco wrote a research paper in March 2018 titled, “Economic Forecasts with the Yield Curve.” In the paper, the Fed uses the difference between the 1-year Treasury note yield and the 10-year Treasury note yield as the yield curve proxy, which also inverted on Friday.
The Fed concludes that every recession since 1955 has been preceded by an inversion. They said, “A simple rule of thumb that predicts a recession within two years when the term spread is negative has correctly signaled all nine recessions since 1955 and had only one false positive, in the mid-1960s, when an inversion was followed by an economic slowdown but not an official recession. The delay between the term spread turning negative and the beginning of a recession has ranged between 6 and 24 months.”
If history is any guide, we could still be a ways off before we should be worried about a recession. For example, prior to the Credit Crisis, the 3s-10s curve inverted on July 17, 2006. The economy didn’t enter recession for more than 17 months until December 2007. In addition, yield curve inversions are not great market timing indicators. Following the inversion in July 2006, the S&P 500 continued higher for nearly 15 months and gained an additional 29% before topping out on October 9, 2007.
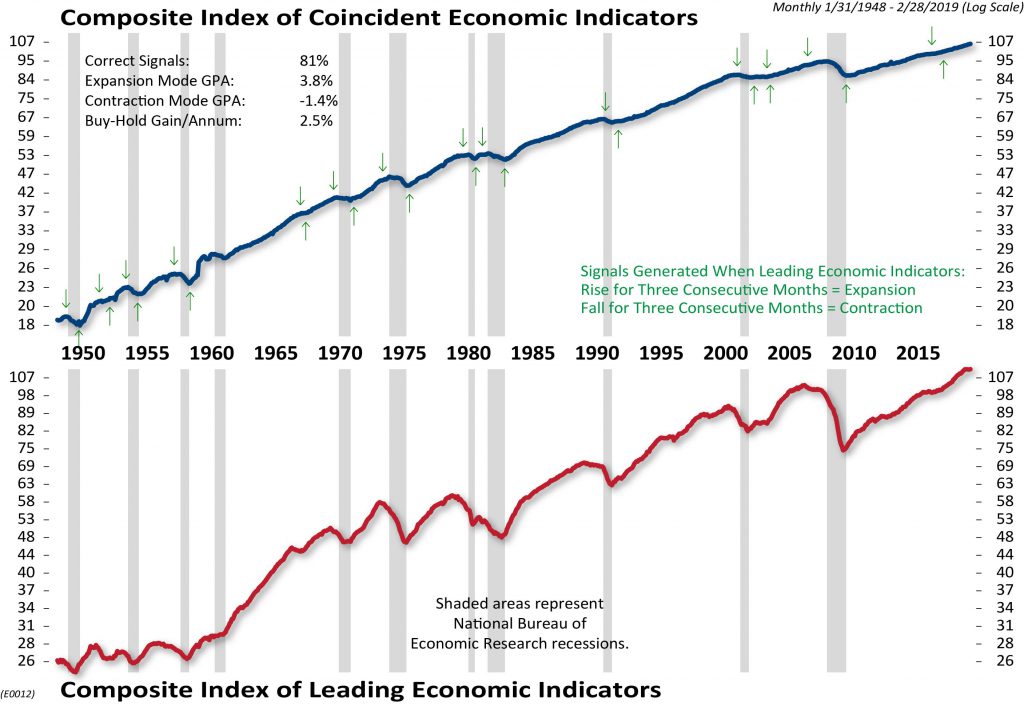
The Conference Board’s Index of Leading Economic Indicators is currently showing no real signs of weakness. The latest reading at the end of February marks an all-time high. That is important because since 1960, the average lead time of a peak in Leading Indicators before the start of a recession has been 11 months. Prior to the last three recession to hit the U.S. economy, leading indicators were declining for an average of 16 months. The lack of decline in Leading Indicators suggests the economy has more runway before we should be concerned about recession.
Finally, the labor market remains healthy. The unemployment rate is only 3.8% and a solid labor market continues to underpin consumption, which is the most important driver of U.S. economic activity. Average monthly job creation remains well above what would be expected so late in the cycle.
In addition, initial jobless claims are hovering near their lowest levels since December 1969! Normally, jobless claims start rising precipitously 6-12 months prior to the start of an economic recession. We are not seeing the kind of weakness in the labor market at this time that would suggest a recession is right around the corner.
So what now? We remain focused on the message of the economic indicators and will continue to monitor them as the economic cycle continues to age. For now, we believe they do not suggest a recession is imminent. In fact, a recession is still likely at least 12 months away, if not more. As we mentioned in our 2019 Market Outlook, we expect the economy to grow a little better than 2.0% in 2019. If anything changes with our economic outlook, we will adjust accordingly and keep you informed.
Sean Clark is the Chief Investment Officer at Clark Capital Management, which is a participant in the ETF Strategist Channel.