

![]()
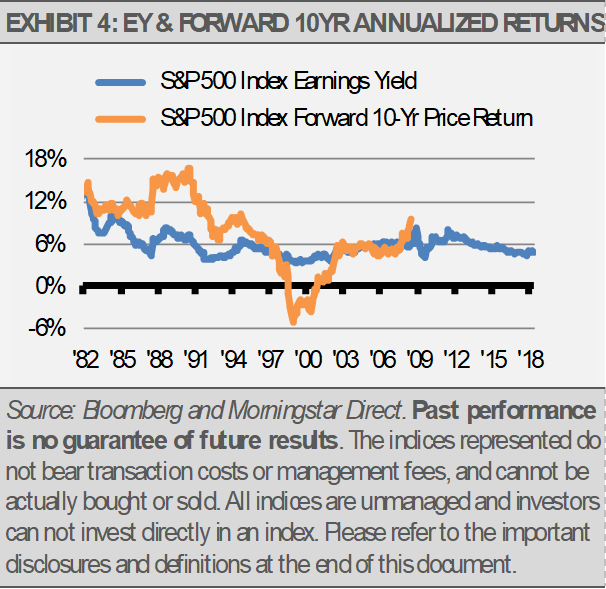
At these levels, the earnings yield suggests that U.S. equities can compound at a 5-7% annualized total return going forward, stock market volatility aside. With our expectations for investment grade fixed income total return around 3%, we think it makes sense to maintain an equity tilt.
INVESTMENT IMPLICATIONS
In aggregate, our indicators suggest little chance of a recession in the next 12 months, so we expect further economic growth. We anticipate Q3 2018 S&P 500 earnings to be 20% higher than last year. Though we expect the pace of economic growth to slow, along with higher corporate revenues and earnings, this growth should lead to higher stock prices over the next year, though it may be a bumpy ride.
We think the positive effects from tax cuts and increased government spending will fade just as interest rate hikes from the Fed begin to bite. Slower economic growth should keep a lid on long-term interest rates. Slower growth and range-bound or falling long-term interest rates should benefit defensive sectors and longer-duration fixed income holdings, such as taxable municipal bonds. In addition, further rate hikes may benefit floating rate funds as well.
As previously mentioned, we recently added a dividend-oriented domestic equity position that we think can add stability to our strategies.
In addition, we moved back into emerging markets equities. Though we are still underweight emerging market exposure compared to the global equity market and have room to add, we thought that it made sense to start building positions in emerging markets at these levels. Developed markets like Japan also look interesting and we are increasingly watching Europe.
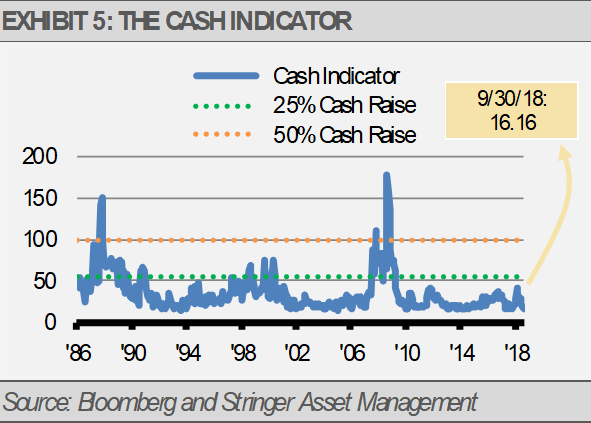
THE CASH INDICATOR
As of the end of September, the Cash Indicator (CI) slipped well below its historical average. This suggests that there is plenty of liquidity in the global markets. However, we have seen a significant uptick in volatility as interest rates have risen. We have been writing about our expectations for greater volatility for the better part of a year and we expect the CI to rise, along with equity market volatility, as economic growth slows. Without signs of recession or a huge spike in the CI, market dips should be buying opportunities. One of the primary benefits of the CI is to help differentiate between normal market volatility and systematic market breakdowns. Our work suggest that this is the former.
This article was written by Gary Stringer, CIO, Kim Escue, Senior Portfolio Manager, and Chad Keller, COO and CCO at Stringer Asset Management, a participant in the ETF Strategist Channel.
DISCLOSURES
Any forecasts, figures, opinions or investment techniques and strategies explained are Stringer Asset Management, LLC’s as of the date of publication. They are considered to be accurate at the time of writing, but no warranty of accuracy is given and no liability in respect to error or omission is accepted. They are subject to change without reference or notification. The views contained herein are not be taken as an advice or a recommendation to buy or sell any investment and the material should not be relied upon as containing sufficient information to support an investment decision. It should be noted that the value of investments and the income from them may fluctuate in accordance with market conditions and taxation agreements and investors may not get back the full amount invested.
Past performance and yield may not be a reliable guide to future performance. Current performance may be higher or lower than the performance quoted.
The securities identified and described may not represent all of the securities purchased, sold or recommended for client accounts. The reader should not assume that an investment in the securities identified was or will be profitable.
Data is provided by various sources and prepared by Stringer Asset Management, LLC and has not been verified or audited by an independent accountant.
Index Definitions:
S&P 500 Index – This Index is a capitalization-weighted index of 500 stocks. The Index is designed to measure performance of a broad domestic economy through changes in the aggregate market value of 500 stocks representing all major industries.