
Confluence Investment Management offers various asset allocation products which are managed using “top down,” or macro, analysis. We publish asset allocation thoughts on a weekly basis in this report, updating the report every Friday, along with an accompanying podcast.
A note to readers: The Asset Allocation Weekly will go on holiday hiatus following today’s report and return as a bi-weekly publication, now on Mondays, beginning January 10, 2022. From all of us at Confluence Investment Management, we wish you a Merry Christmas and Happy New Year! See you in 2022! Bond yields—and the relationships between them—can be some of the most important economic and financial indicators an investor can watch, and yields today are telling an important story.
The “yield curve,” which graphs market yields by maturity, has recently been flattening as the difference between long-term yields and short-term yields has gotten narrower. It is the first time such a flattening has happened in almost five years, so this article takes a close look at what that flattening is telling us about the economy going forward.
A complete yield curve would plot the yields for all maturities at a given point in time. A quick summary of the yield curve and its evolution is provided by simply graphing the yield on the 10-year Treasury note minus the yield on the 2-year Treasury note over time, as shown in the chart below. Over the last two decades, the yield on the 10-year Treasury has typically been 1.35% higher than the yield on the 2-year Treasury. When the economy is recovering from a recession or otherwise starting to accelerate, investors often anticipate higher inflation and improved opportunities in equities off into the future, so they buy fewer longer-term obligations. That pushes their prices down and boosts their yields relative to shorter-term obligations. The yield curve then steepens. As shown in the chart below, that is exactly what happened during the year after the coronavirus pandemic first slammed the U.S. economy in early 2020. By the spring of 2021, the difference between the 10-year Treasury yield and the 2-year Treasury yield widened to 1.47%, surpassing its 20-year average for the first time in half a decade.
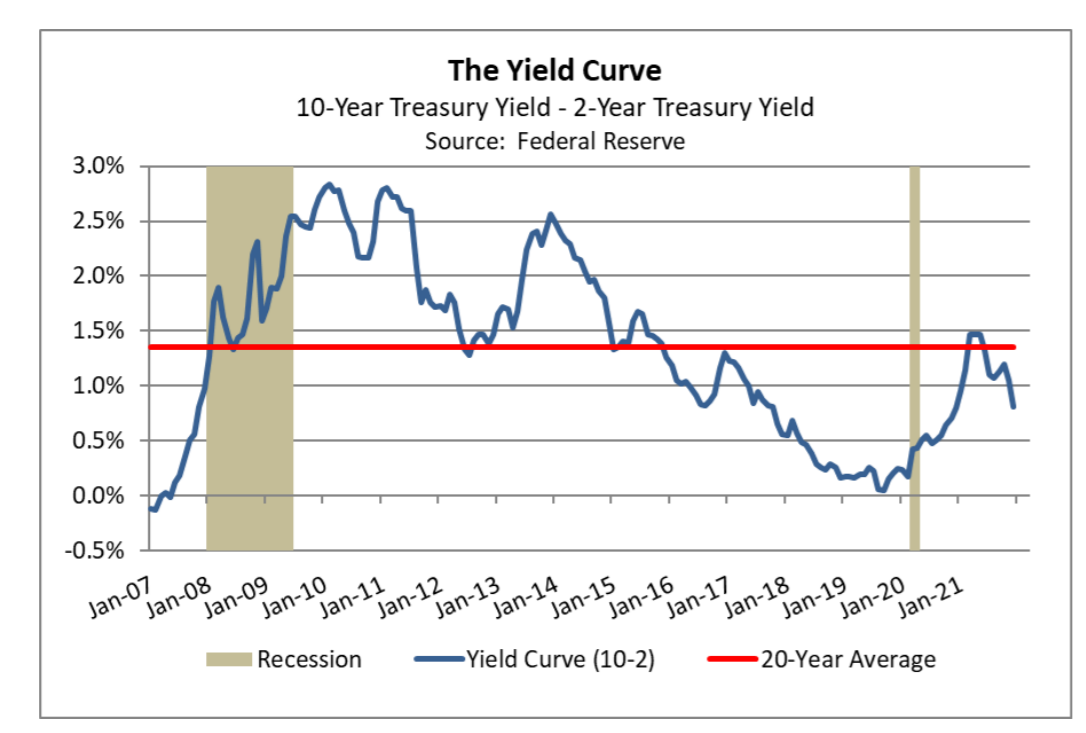
More recently, however, the yield curve has started to flatten again. The 10-year yield currently stands just 0.80% above the 2-year yield. What explains this dramatic reversal? We think it reflects two closely related expectations among investors. First, price inflation has worsened throughout 2021 and is showing no signs of being as short-lived or “transitory” as Fed policymakers expected. Investors rightly guessed that sticky inflation would scare the Fed into tightening monetary policy sooner than originally planned. Last month, the Fed began to taper its bond purchases, and it has recently signaled it will soon accelerate its taper enough to stop all bond buying by early 2022. That would position the Fed to begin hiking its benchmark shortterm interest rate in the first half of 2022. Buying enthusiasm for short-term obligations consequently weakened, driving up their yields. This is seen clearly in the sharp increase in 2-year Treasury yields (see the green line on the chart below).
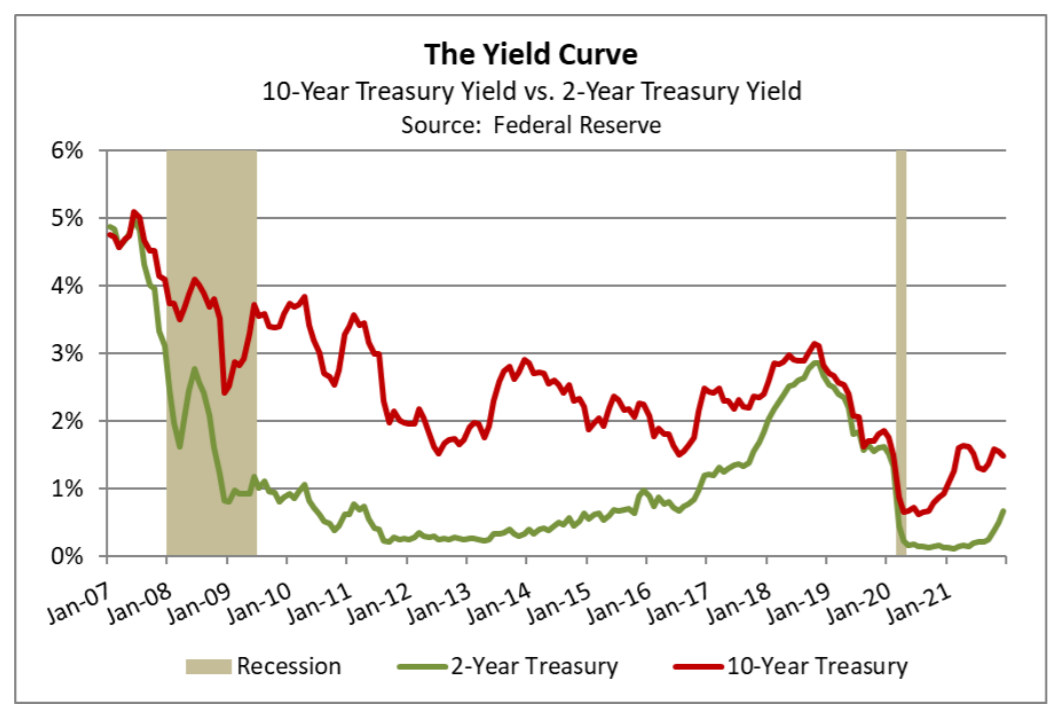
Just as important, we think the market action shows that investors have also adopted a more pessimistic view of longer-term economic performance. Investors appear to expect a return to sluggish growth, perhaps because they think the Fed will tighten monetary policy too sharply over the coming months. Not only have shorter-term yields jumped, but the chart shows that longer-term yields have plateaued well below their typical level during the previous expansion (see the red line in the chart above). In fact, the yield on the 10-year Treasury note is currently below its minimum level from 2008 to 2019. Expecting bond yields to be that low over the next
decade implies an expectation for very weak economic growth and low inflation.
What could cause such an outcome? It might result from the global economy reverting to its prepandemic state, in which growth and inflation were held in check by big, structural headwinds, such as slowing birth rates, population aging, high-income inequality, excessive debt, expanding globalization, and new technologies. However, some of those headwinds, such as globalization, appear to be retreating. We believe that much of the plateauing in longer-term yields reflects a fear among investors that the Fed will tighten monetary policy too much. Such a policy mistake by the Fed could short-circuit the budding economic expansion and produce a new recession, especially considering much of the federal government’s pandemic fiscal stimulus will be withdrawn over the next year. For near-term asset allocation strategy, any further flattening in the yield curve would, therefore, suggest increased caution regarding risk asset.
Past performance is no guarantee of future results. Information provided in this report is for educational and illustrative purposes only and should not be construed as individualized investment advice or a recommendation. The investment or strategy discussed may not be suitable for all investors. Investors must make their own decisions based on their specific investment objectives and financial circumstances. Opinions expressed are current as of the date shown and are subject to change.
This report was prepared by Confluence Investment Management LLC and reflects the current opinion of the authors. It is based upon sources and data believed to be accurate and reliable. Opinions and forward-looking statements expressed are subject to change. This is not a solicitation or an offer to buy or sell any security.