

After putting in a low in June, markets rallied in the month of the July. This rally was largely led by technology-related stocks. The Nasdaq 100 is a mostly tech-related index and studies show that when the Nasdaq leads the other markets, it is usually a positive signal, particularly during a bull market. We all know that 2022 has not been a bull market, but seeing the Nasdaq lead is a positive development, considering that technology stocks had by-and-large led the markets downward in the first six months of this year.
So here is the big question that investors are asking: “have we seen the market’s bottom yet?” Investors who “panic sold” in the June downturn are now left with the choice of getting back in at a higher price or waiting for markets to decline further and shift their emotions back from one extreme to the other.
Here is what we do not know:
We normally produce a “bottom line” commentary segment at the end of our blogs, but here is the bottom line a bit early: no one knows what the market’s low point will be, nor do they know when it will happen. The truth is that hindsight is 20/20 and we won’t know whether or not we have seen a market low until we see a new market high.
Here is what we do know:
- Volatility remains high. Currently, the Canterbury Volatility Index measures CVI 125. That has come off a bit with the recent rally. The S&P 500 hit a high point of CVI 148 back in June.
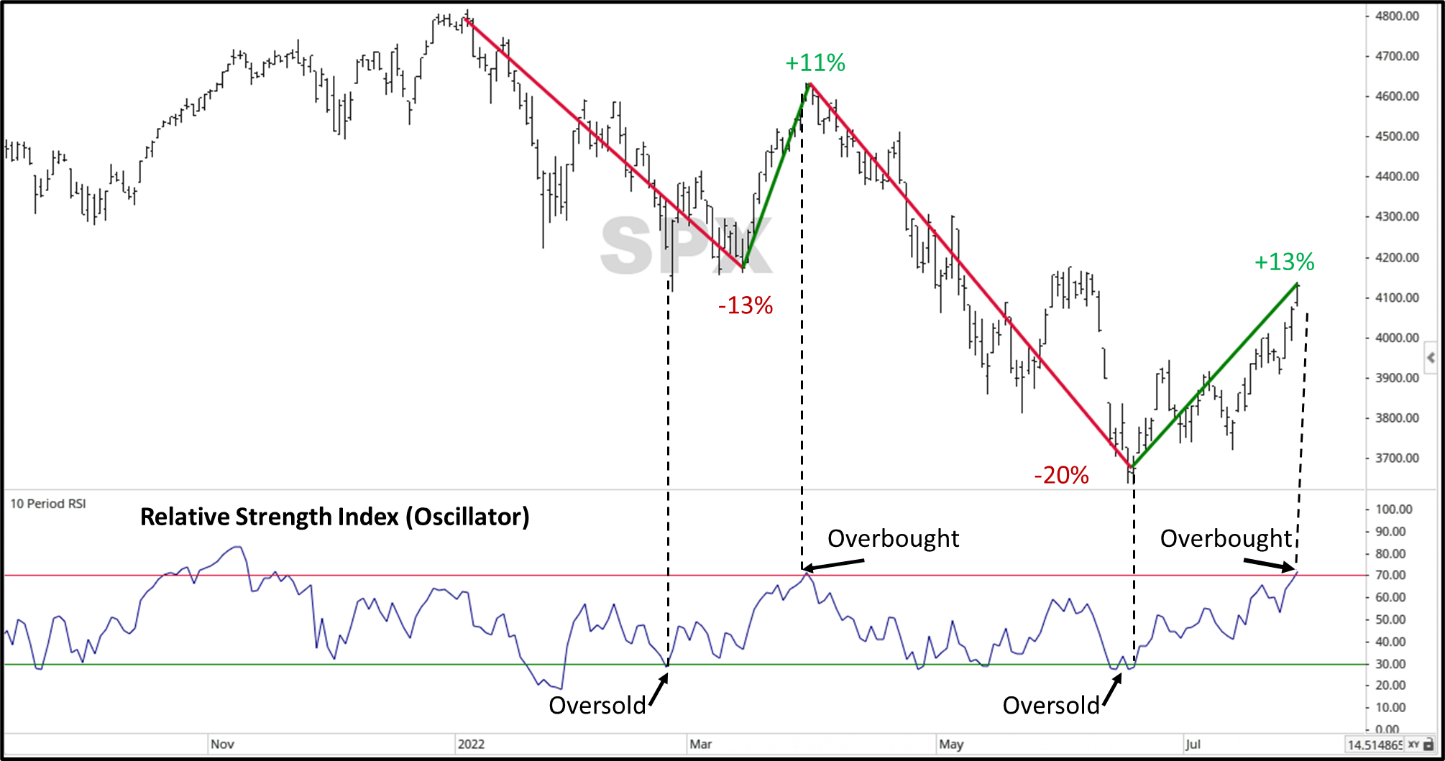
- This is not the first time the market has rallied this year, during a bear market. Back in March, after declining -13% from its peak, the S&P 500 rallied +11% in 15 days. Following that rally, the market dropped -20% to the low in June.
- The market is overbought. Looking at some technical indicators, the S&P 500’s relative strength index oscillator (RSI) is above 70, which means that its price movement is overextended, and AIQ Trading Expert Pro’s expert rating shows that the index is 91% overbought. Does this mean that market won’t continue to go up? No, but it shows there is a higher probability of a decline than there is a further rally.
In the chart below, we have highlighted two of the points above. First, we illustrate the swings in the market. You can see that a -13% decline was followed by an increase of +11%, before declining another -20%. Now, the market has seen a +13% rally. Will that rally continue, or will we see another decline?
Second, the chart shows the Relative Strength Index (Oscillator) which measures the strength in the price movements of an individual index or security. The indicator uses lines at RSI 30 and RSI 70 to measure if a security is overbought or oversold. You can see when the index has become oversold, it rallied. On the other hand, after the +11% rally in March/April, the index became overbought and declined. Now, once again, the index is overbought. It should be noted that being overbought does not guarantee a substantial decline. Securities can remain overbought.
Source: Optuma Technical Analysis Software
Emerging Markets
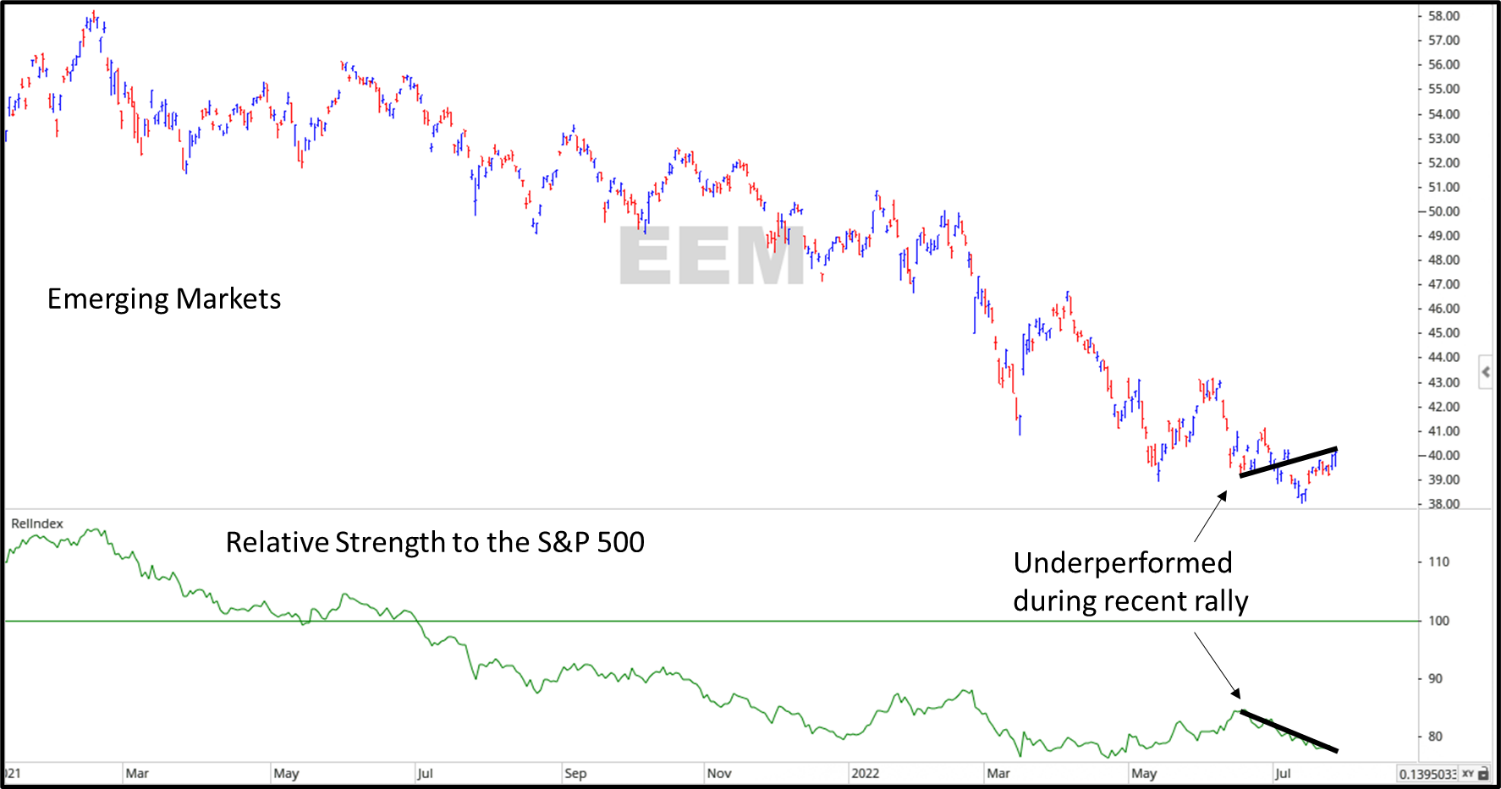
As a quick point, we all know that the global markets have declined in 2022. Emerging Markets, however, has been struggling much longer. The emerging markets index is exposed to countries such as China, India, Taiwan, and South Korea. These four components make up 73% of the index, with China alone accounting for 30%. In the chart below, you can see an Emerging Market ETF (Ticker: EEM) that has been declining since the beginning of 2021. You can also see that the relative strength of Emerging Markets compared to the S&P 500 has been steadily declining. What this means is that during most of the down periods in the market, Emerging Markets has done worse. When the S&P 500 has kicked back, like it has recently, Emerging Markets has also underperformed.
Source: Optuma Technical Analysis Software
Bottom Line
We will reiterate the point we made earlier: no one knows what the market’s low point will be, nor do they know when it will happen. Speculation of a potential low point will often prove false. Right now, we are still in Market State 9, which is bearish. Volatility is high and cautionary; we have seen previous bear market rallies fall short and put in new lows; and by many technical metrics, the market is overbought. One positive going for the market is that technology is leading, but it also led on the markets previous large rally back in the spring prior to a large decline.
From a portfolio management standpoint, we continue to monitor the market’s rotations. Emerging Markets has been very weak, and has consistently underperformed, mostly due to China’s weakness. A position like “inverse” emerging markets, which moves in the opposite direction provides stabilization to a portfolio. According to our rankings, defensive sectors remain near the top of our lists.
For more news, information, and strategy, visit VettaFi.com.