

(Source: MSCI, Bloomberg, Accuvest Global Advisors)
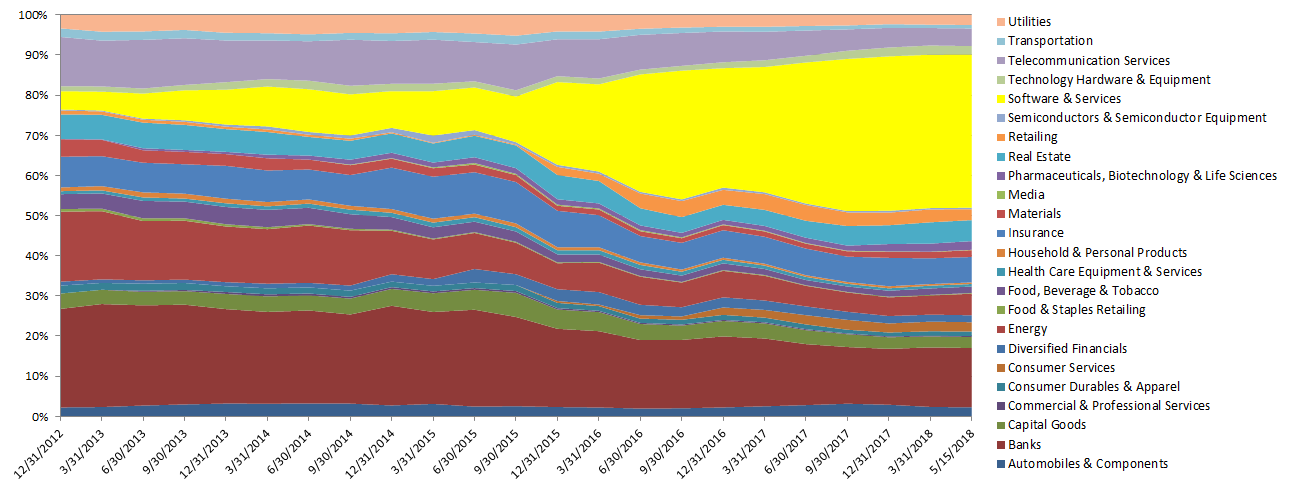
Chart 4: MSCI China Industry Group Weights – The Last 5 Years
![]()
 (Source: MSCI, Bloomberg, Accuvest Global Advisors)
The two largest companies within the MSCI China Index are Tencent (16.9%) and Alibaba (13.3%), and both are members of the Software & Services industry. These companies exhibit sales trajectories and profitability similar to the US FANGs (Facebook, Amazon, Apple, Netflix, and Google).
- Alibaba has witnessed meaningful growth in Online Retail, while expanding into Cloud, Entertainment, Food Delivery, Digital Banking, AI, and Navigation
- Tencent has delivered significant Advertising revenues via Online Gaming Platforms and Social Networks, while expanding into Payments, Cloud Computing, and Video.
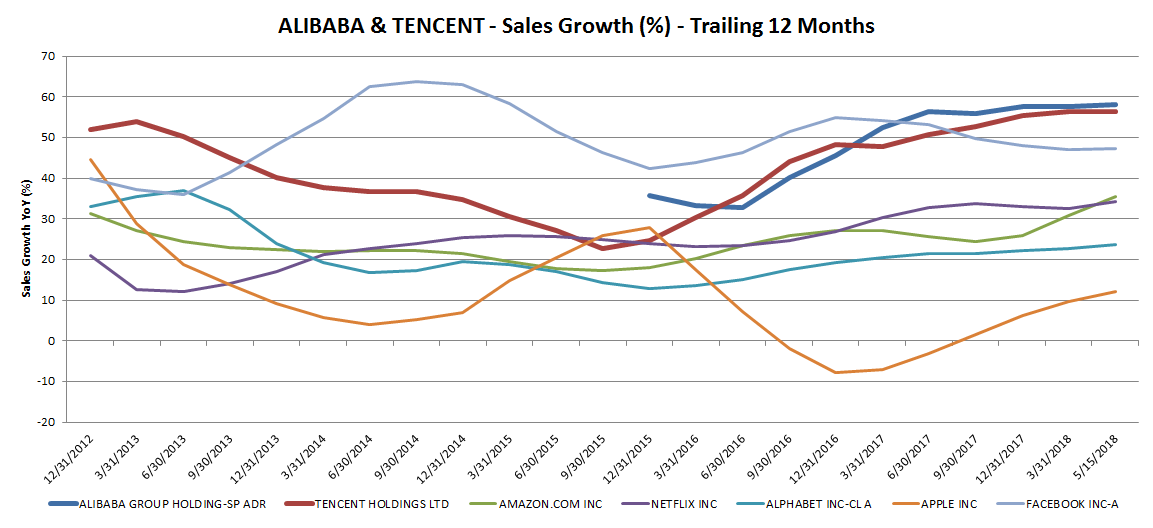
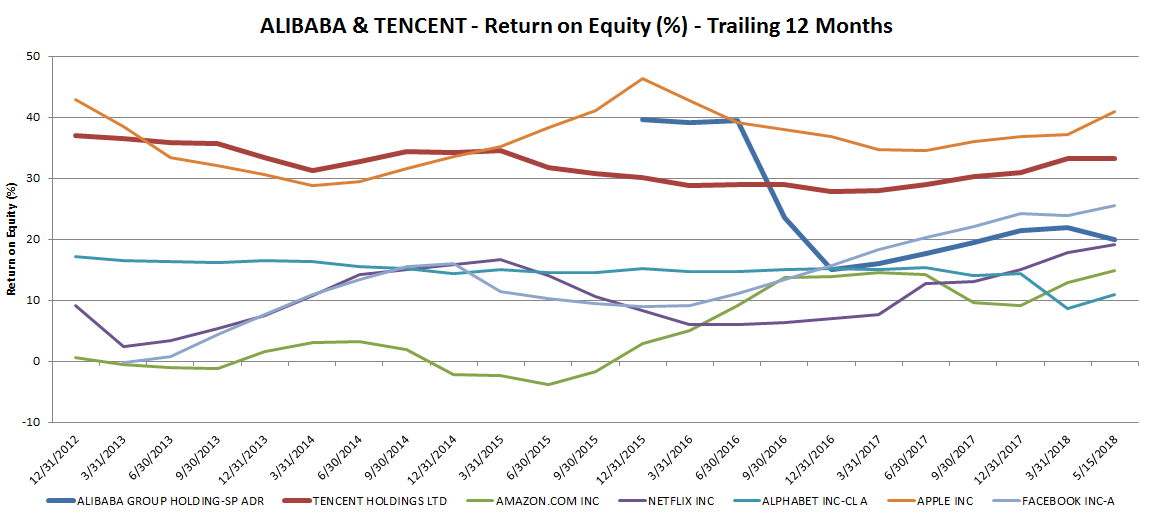
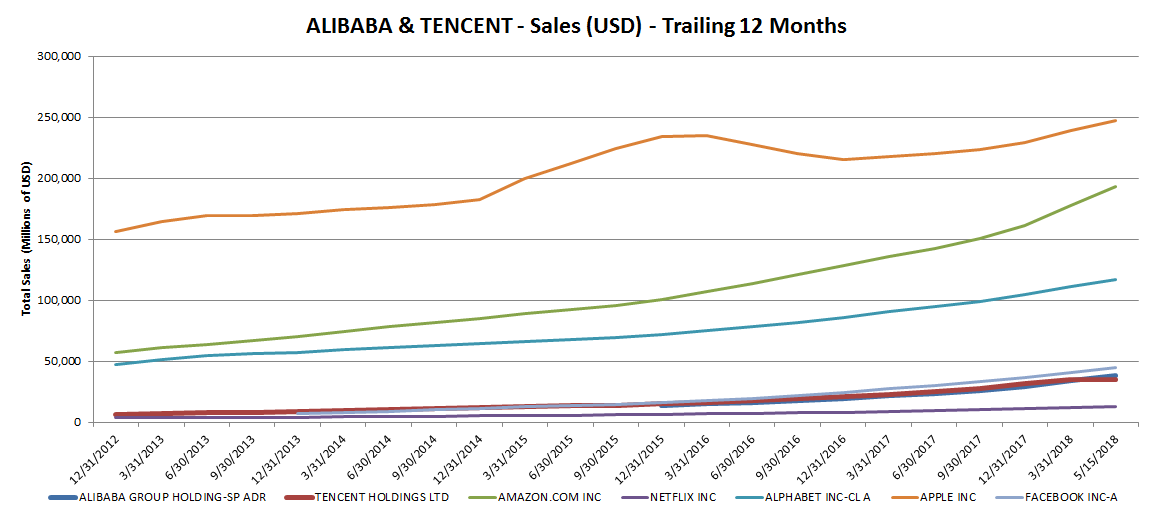
Alibaba and Tencent finished 2017 with year over year sales growth of 57.5% and 55.4%, compared to average FAANG sales growth of 24.1% (Chart 5). Meanwhile, Alibaba and Tencent produced Return on Equity of 21.4% and 30.9% in 2017, compared to an average FAANG ROE of 19.9% (Chart 6). Lastly, Alibaba and Tencent generated 12 month total sales of $37.9B and $35.3B USD in 2017, respectively (Chart 7). While these total sale numbers fall short of the FAANGs average total sales of $108.5B, the trend is young and the opportunity is large for China and neighboring emerging markets. Importantly, China is more than just Alibaba and Tencent, and e-commerce is more than just software & services. For awareness, here are the next 10 largest companies in the MSCI China Index: China Construction Bank, Baidu, Industrial & Commercial Bank of China, China Mobile, Ping An Insurance, Bank of China, Cnooc, China Petroleum & Chemical Corp., JD.com, and China Life Insurance.
Chart 5: Alibaba & Tencent: Sales Growth vs. US FAANGs – The Last 5 Years
(Source: MSCI, Bloomberg, Accuvest Global Advisors)
Chart 6: Alibaba & Tencent: Return on Equity vs. US FAANGs – The Last 5 Years
(Source: MSCI, Bloomberg, Accuvest Global Advisors)
Chart 7: Alibaba & Tencent: Total Sales vs. US FAANGs – The Last 5 Years
(Source: MSCI, Bloomberg, Accuvest Global Advisors)
In conclusion, China’s top-ranked fundamentals are well supported by historical sales growth and strengthening secular trends in demographics and e-commerce. Forward expectations for Alibaba and Tencent (software & services) earnings growth appear solid based on the historical path of total sales and profitability achieved by the US FAANGs peer group. Software is pervasive and applies to multiple segments of personal consumption. True innovation in software & e-commerce will likely complement a broadening “urban” middle class and provide opportunity for growth in industries like banking, healthcare, energy, transportation and media.
This article was written by the team at Accuvest, a participant in the ETF Strategist Channel.